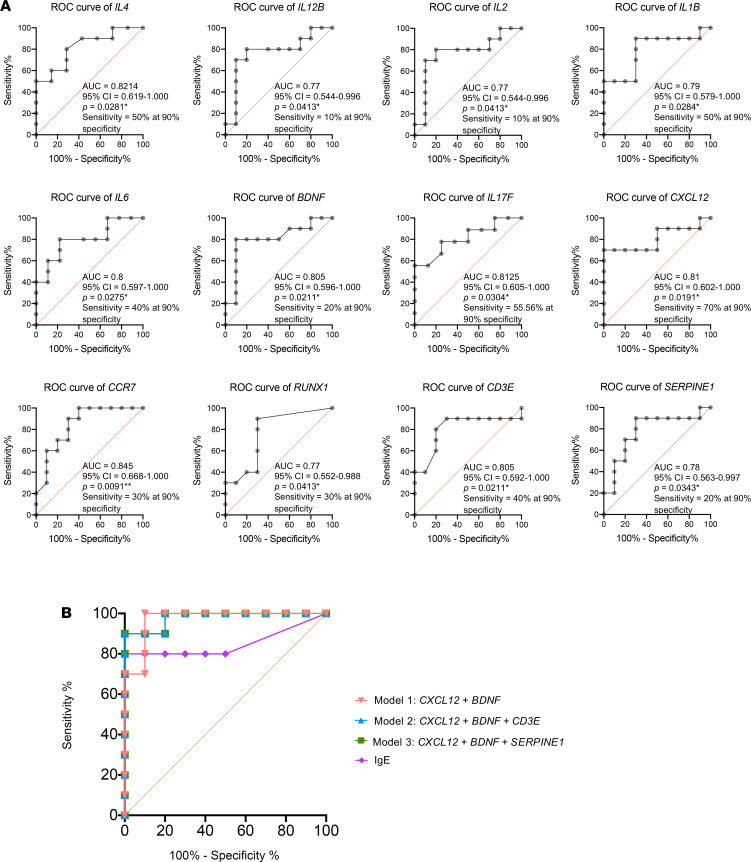
Figure 4. ROC analysis is applied to evaluate the performance of DNAm signatures for discrimination of PA versus NA groups.
(A) ROC curves show the AUC and the sensitivity and specificity for each of the 12 DNAm signatures. (B) ROC curves show the AUC, and the sensitivity and specificity, for comparison of 3 models with the combination DNAm signatures against peanut-specific IgE in serum.

