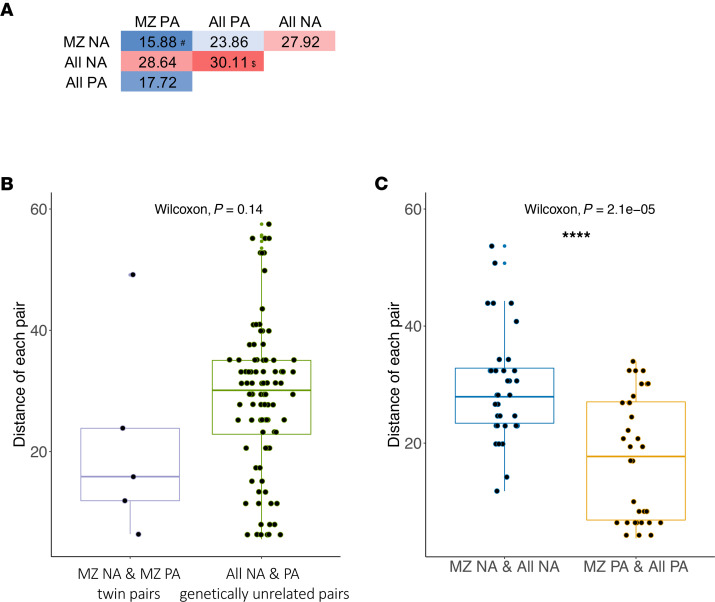
Figure 5. Peanut allergy–associated DNAm levels in 12 targeted genomic regions are genetically influenced.
(A) Euclidean distances of 12 DNAm signatures were calculated pairwise either between 5 MZ twin pairs (5 pairs) who are discordant for peanut allergy or randomly selected genetically unrelated pairs (95 pairs) (i.e., 1 sample has peanut allergy and the other is nonallergy without peanut allergy). #Median of the distance within 5 discordant MZ twin pairs. $Median of the distance of all 95 genetically unrelated NA and PA pairs. (B) Box plots overlaid with dot plots represent the Euclidean distances between MZ PA and NA twin pairs (pairs = 5, left panel) and genetically unrelated individuals in PA participants and in NA individuals (pairs = 95, right panel). (C) Box plots overlaid with dot plots represent the Euclidean distances between random pairs, of which 1 of each pair is an NA MZ twin and the other is a genetically unrelated NA individual (pairs = 35, left panel), and random pairs, of which 1 of each pair is a PA MZ twin and the other is a genetically unrelated PA individual (pairs = 35, right panel). Box plots indicate the interquartile range (IQR) and median; whiskers extend to the farthest data point within a maximum of 1.5× IQR. The Wilcoxon rank sum test (2 sided) was used for comparison analysis. ***P < 0.001.

