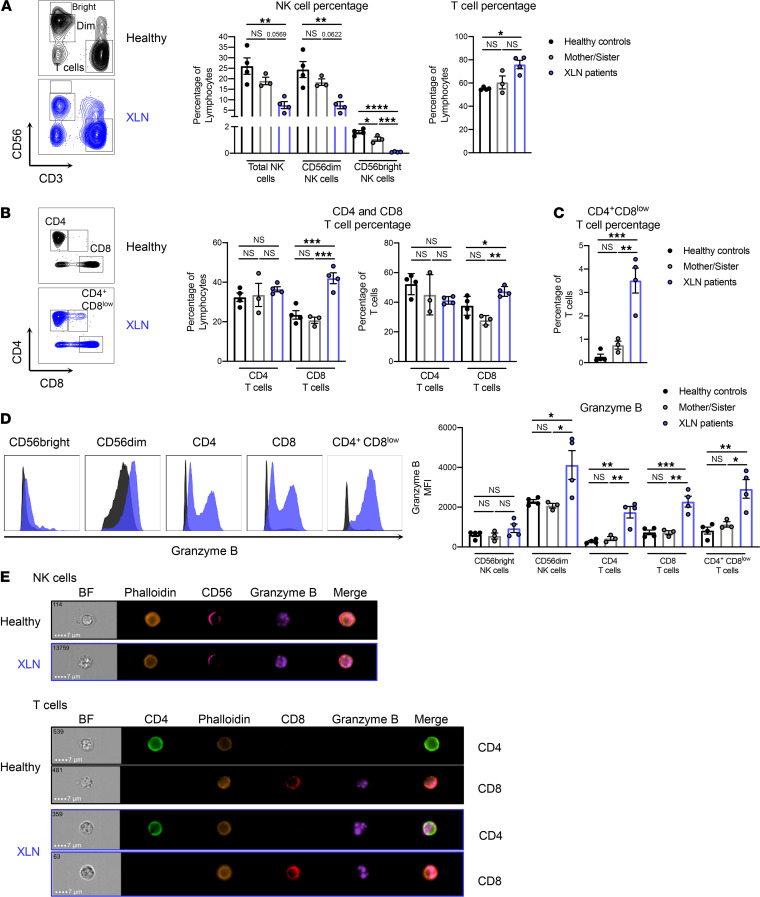
Figure 1. XLN patients have altered NK and T cell populations that display increased granzyme B content.
(A) CD56 and CD3 and (B) CD4 and CD8 staining on PBMCs from 2 XLN patients, the mother and the sister of the patients, and 2 healthy controls. Representative flow cytometry plots are shown at left and graphs of NK and T cells at right. (C) The percentage of the CD3+CD4+CD8lo T cell population in the 2 XLN patients, the mother and the sister of the patients, and 2 healthy controls. (D) Granzyme B expression in CD56bright and CD56dim NK cells and CD4+, CD8+, and CD3+CD4+CD8lo T cells. Representative flow cytometry plots are shown at left and graphs of the granzyme content in NK and T cells of XLN patients and controls at right. (E) Imaging flow cytometry of the granzyme B granules in NK cells (top) and CD4+ and CD8+ T cells (bottom) from the XLN patients and healthy controls. Representative images of bright-field (BF) and the fluorescent markers are shown. The data represent 2 individual experiments combined. Graphs show mean values ± SEM and significance was assessed by 1-way ANOVA. *P ≤ 0.05, **P ≤ 0.01, ***P ≤ 0.001.

