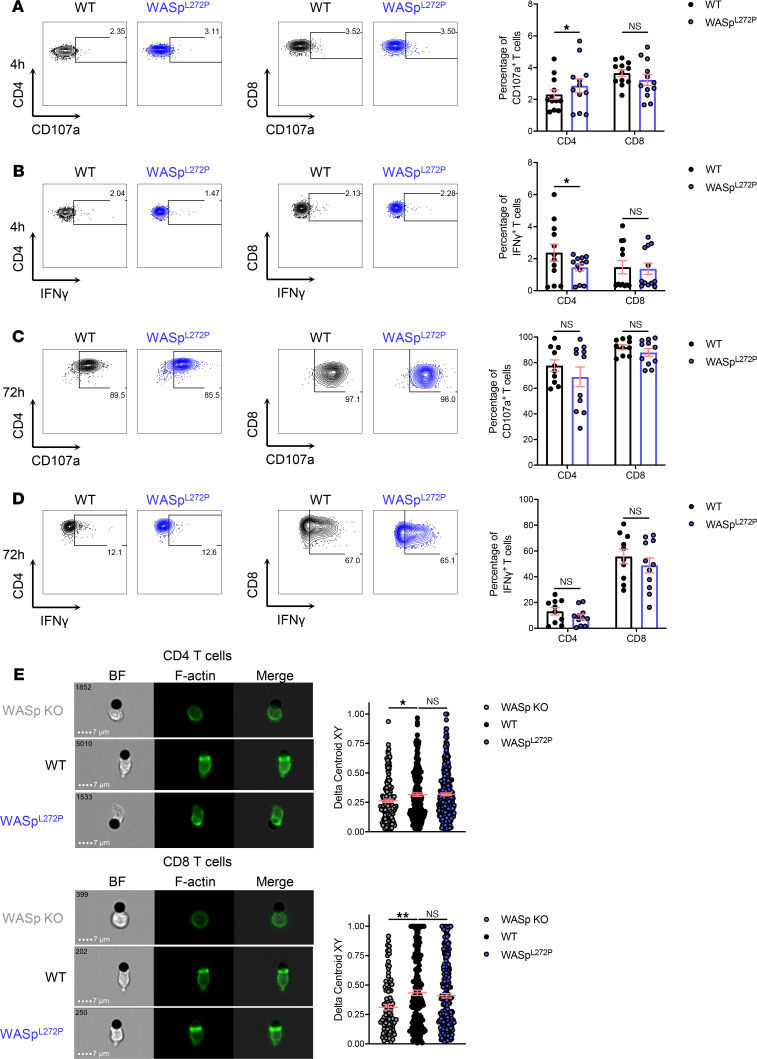
Figure 4. T cells from WASpL272P mice respond to stimulation and form lytic synapses.
(A) Degranulation in CD4+ and CD8+ T cells from WT and WASpL272P mice after a 4-hour anti-CD3 and anti-CD28 stimulation. (B) IFN-γ production in CD4+ and CD8+ T cells from WT and WASpL272P mice after a 4-hour anti-CD3 and anti-CD28 stimulation. Representative plots are shown on the left, and quantification of 4 experiments is shown on the right. Each dot represents 1 mouse. WT n = 12, WASpL272P n = 12. (C) Degranulation in CD4+ and CD8+ T cells from WT and WASpL272P mice after a 72-hour anti-CD3 and anti-CD28 stimulation. (D) IFN-γ production in CD4+ and CD8+ T cells from WT and WASpL272P mice after a 72-hour anti-CD3 and anti-CD28 stimulation. Representative plots are shown on the left, and quantification of 4 experiments is shown on the right. Each dot represents 1 mouse. WT n = 10, WASpL272P n = 11. Graphs show mean values ± SEM and significance was assessed by 2-tailed Student’s t test and the Mann-Whitney correction. (E) Synapse formation between WASp-KO, WT, and WASpL272P CD4+ T cells (top) and CD8+ T cells (bottom) with anti-CD3/CD28–coated beads. Actin is shown in green (LifeActGFP). The Delta Centroid value indicates the extent of polarized fluorescence towards the synapse. A representative experiment of 3 is shown. Each dot represents 1 conjugate. CD4+ WASp-KO n = 165, WT n = 200, WASpL272P n = 303, CD8+ WASp-KO n = 100, WT n = 185, WASpL272P n = 258. Graphs show mean values ± SEM and significance was assessed by 1-way ANOVA. *P ≤ 0.05.

