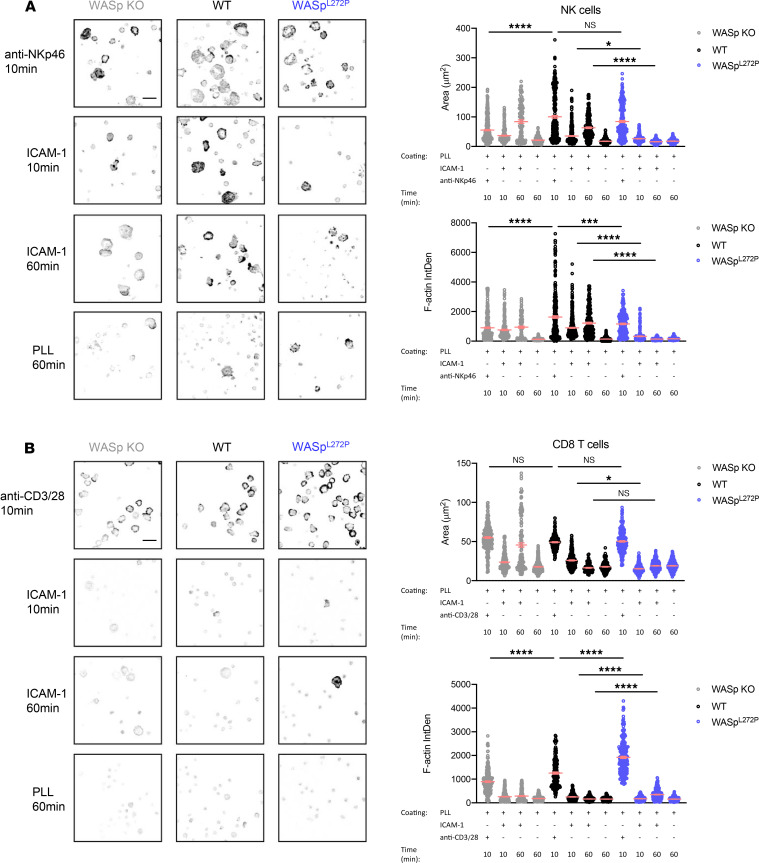
Figure 5. NK and CD8+ T cells from WASpL272P mice have a different spreading and F-actin polarizing response on coated glass.
(A and B) Confocal images of WASp-KO, WT, and WASpL272P (A) NK cells and (B) CD8+ T cells to assess attachment and F-actin density toward the indicated coated surface. Representative images are shown (left) and graphs quantifying the attachment area (top right) and F-actin density by confocal imaging (bottom right) in arbitrary units. Images are displayed as inverted gray scale Lookup Table of phalloidin staining. Two individual experiments combined are shown. Each dot represents 1 cell. For each condition, between 200 and 400 cells were analyzed. Graphs show mean values ± SEM and significance was assessed by 1-way ANOVA. *P ≤ 0.05, ***P ≤ 0.001, ****P ≤ 0.0001.

