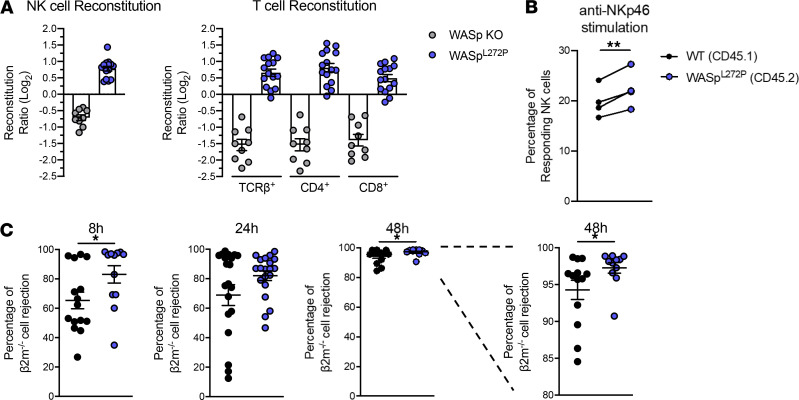
Figure 6. WASpL272P NK and T cells have a reconstitution advantage in vivo, and WASpL272P mice exhibit increased responsiveness against MHC class I–deficient hematopoietic grafts.
(A) Ratios of CD45.2 WASpL272P/CD45.1 WT and CD45.2 WASp-KO/CD45.1 WT NK cells (left) and T cells (right) in spleens of mixed bone marrow chimera mice. Ratios were normalized by their original bone marrow ratio (CD45.2/CD45.1) and plotted on a logarithmic scale. The data represent 3 individual experiments combined. Each dot represents 1 mouse. WASp-KO/WT n = 9, WASpL272P/WT n = 15. Graph shows mean values ± SEM. (B) Stimulation of splenic NK cells from mice reconstituted with a mix of WT and WASpL272P bone marrow cells. One representative experiment is shown, n = 4. Each dot represents 1 mouse and the lines connect NK cells from the same mouse. Graph shows mean values ± SEM and significance was assessed by paired 2-tailed Student’s t test. (C) Rejection of β2m–/– splenocytes in WT and WASpL272P mice after 8, 24, and 48 hours. Each dot represents 1 mouse. The data represent 3 individual experiments combined. 8 hours and 48 hours: WT n = 15, WASpL272P n = 12; 24 hours: WT n = 21, WASpL272P n = 20. Graphs show mean values ± SEM and significance was assessed by 2-tailed Student’s t test and the Mann-Whitney correction. *P ≤ 0.05, **P ≤ 0.01. If no other indication, results were not significant.

