. 2021 Mar 11;10:e66835. doi: 10.7554/eLife.66835

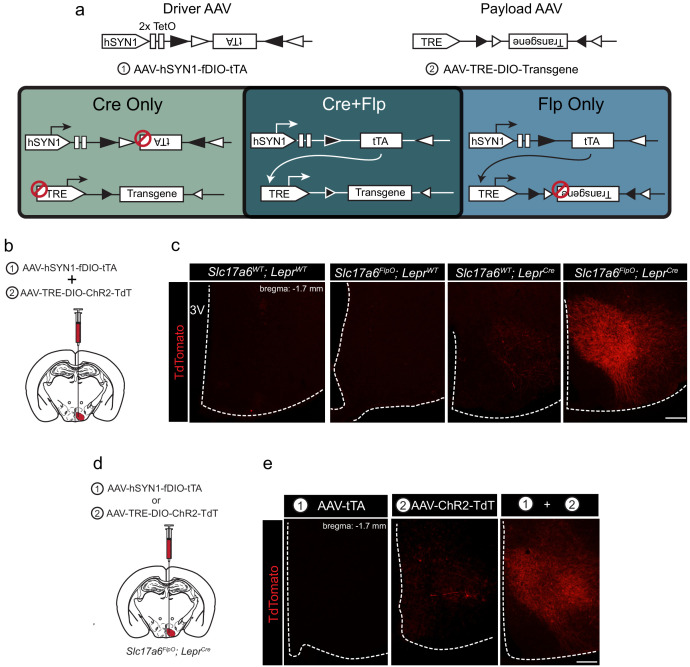
Figure 1. tTARGIT AAVs: a dual virus system to target intersectional populations.

(a) The tTARGIT system employs the combination of ‘Driver’ (AAV-hSYN-fDIO-tTA) and ‘Payload’ (AAV-TRE-DIO-Payload) AAVs. The Driver virus encodes a Flp-dependent tetracycline transactivator (tTA) under control of the human synapsin I (hSYN1) promoter and two tetracycline operators (TetO). The Payload virus encodes a Cre-dependent Payload transgene under control of the tetracycline response element (TRE). (b,c) Experimental scheme (b) and representative images (c) showing the detection of TdTomato (DSRed-IR, red) following the co-injection of AAV-hSYN-fDIO-tTA and AAV-TRE-DIO-ChR2-TdT into the VMH of (from left to right, as labeled) wild-type (WT), Slc17a6FlpO, LeprCre, or Slc17a6FlpO;LeprCre mice. (d,e) Experimental schematic (d) and representative images (e) showing the detection of TdTomato (DSRed-IR, red) following the injection of (from left to right, as labeled): (1) AAV-hSYN-fDIO-tTA, (2) AAV-TRE-DIO-ChR2-TdT, or the two viruses combined (1+2) into the VMH of Slc17a6FlpO;LeprCre mice. Scale bars = 100 μm.

Figure 1.

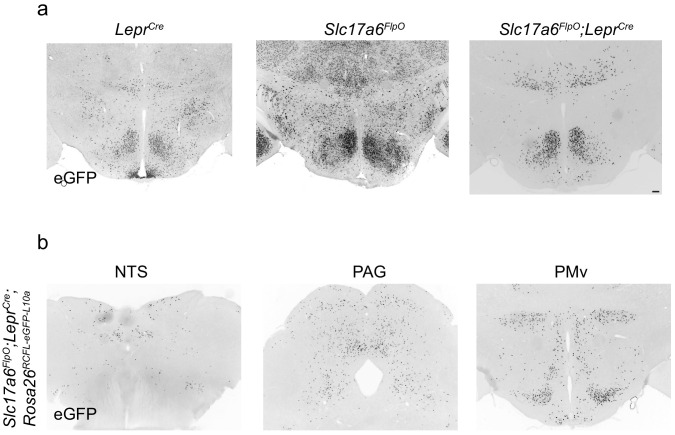
Figure 1—figure supplement 1. An intersectional approach for targeting LepRbVMH neurons.

Figure 1—figure supplement 1.

Representative image of GFP-IR (black) in the (a) hypothalamus of adult LeprCre;Rosa26LSL-eGFP-L10a (LeprCre; left), Slc17a6FlpO;Rosa26FSF-eGFP-L10a (Slc17a6FlpO; middle), and Slc17a6FlpO;LeprCre;R26RCFL-eGFP-L10a (Slc17a6FlpO;LeprCre; right) mice. (b) GFP-IR (black) in the ventral premamillary nucleus (PMv), periaqueductal gray (PAG), and nucleus of the solitary tract (NTS) in Slc17a6FlpO;LeprCre;Rosa26RCFL-eGFP-L10a animals. Scale bar = 100 μm.

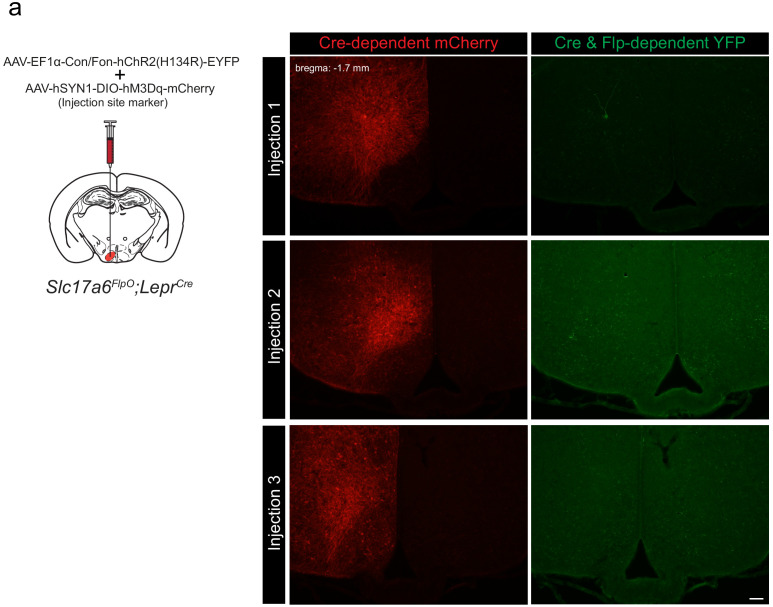
Figure 1—figure supplement 2. INTRSECT transgene expression in Slc17a6FlpO;LeprCre-defined LepRbVMH neurons.

Figure 1—figure supplement 2.

(a) Schematic of unilateral injection strategy for INTERSECT virus and injection site marker into the VMH of Slc17a6FlpO;LeprCre mice. Representative images showing mCherry-IR (red, left) and YFP-IR (green, right) in the VMH of three separate Slc17a6FlpO;LeprCre mice co-injected with a Cre-dependent hM3Dq-mCherry AAV (an injection site marker) and INTERSECT Flp-ON/Cre-ON ChR2-eYFP AAV.

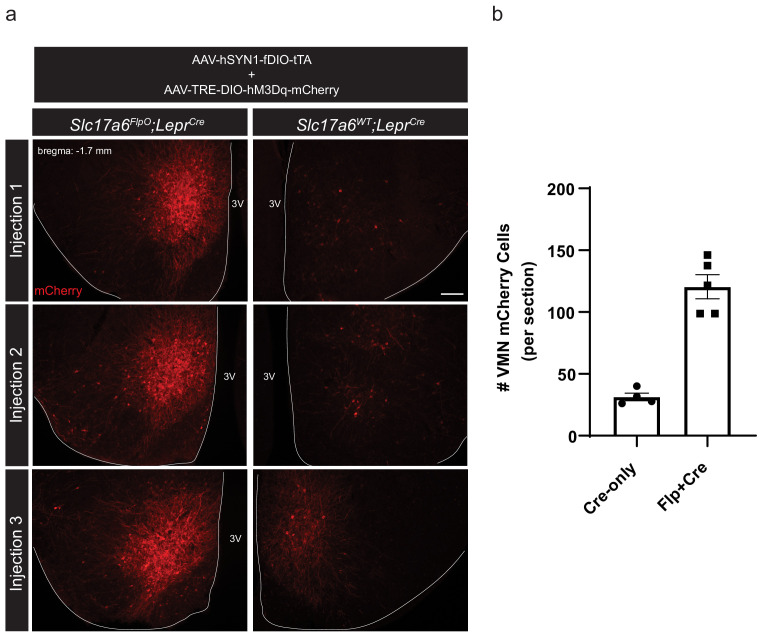
Figure 1—figure supplement 3. VMH hM3Dq-mCherry expression in Slc17a6FlpO;LeprCre and LeprCre-only mice.

Figure 1—figure supplement 3.

Representative images (a) and quantification (b) of mCherry-IR in Slc17a6FlpO;LeprCre and LeprCre-only mice co-injected with AAV-hSYN1-fDIO-tTA and AAV-TRE-DIO-hM3Dq-mCherry. Data presented as mean ± SEM. Scale bar = 100 μm. 3V = third ventricle.

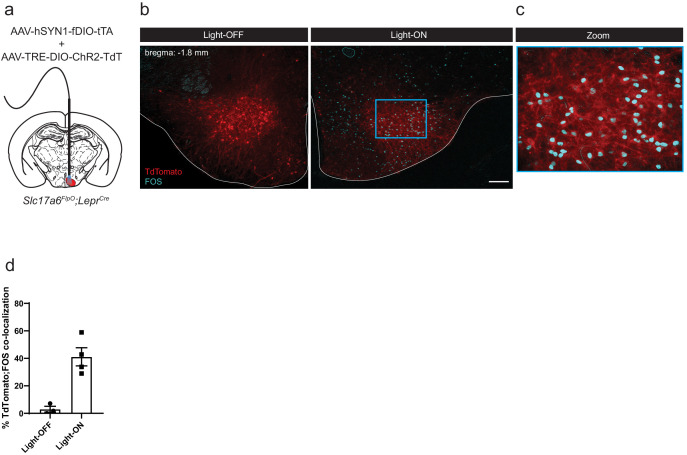
Figure 1—figure supplement 4. FOS response to photostimulation of tTARGIT AAV-driven ChR2 production in LepRbVMH cells.

Figure 1—figure supplement 4.

(a) Experimental schematic showing unilateral co-injection of the Flp-dependent tTARGIT Driver AAV and ChR2-TdTomato-expressing tTARGIT Payload AAV targeting the VMH of Slc17a6FlpO;LeprCre mice, with optic fiber implantation. (b,c) Representative images and quantification (d) of ChR2-Tdtomato (red) and FOS-IR (cyan) with either no photostimulation (left) or 1 hr photostimulation (right); (c) a digital zoom on the boxed region in (b). Data presented as mean ± SEM. Scale bar = 100 μm.

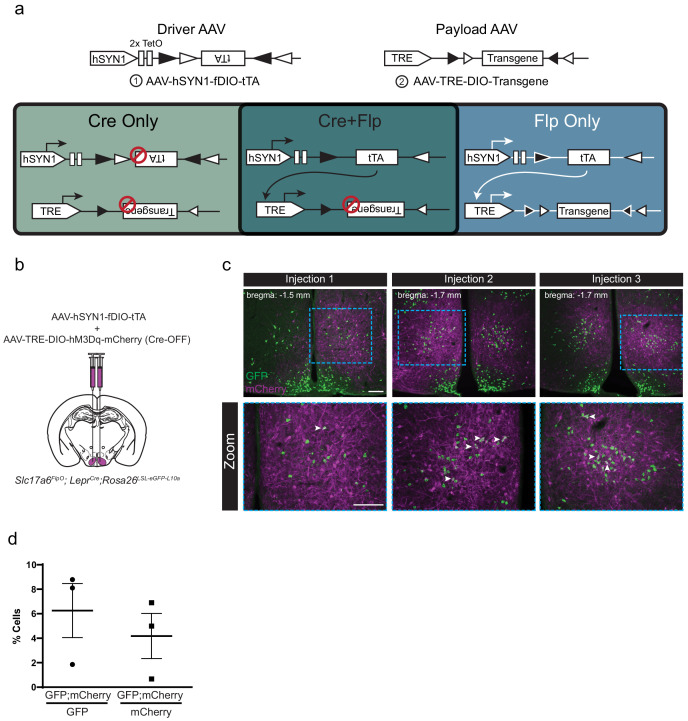
Figure 1—figure supplement 5. Design and validation of the tTARGIT AAV approach to Flp-ON/Cre-OFF genetics.

Figure 1—figure supplement 5.

(a) The tTARGIT Flp-ON/Cre-OFF system is composed of a Flp-dependent tTA Driver virus (1) with a Payload virus (2) in which the transgene lies in the forward orientation unless Cre mediates its inversion. (b–d) Schematic of Flp-ON/Cre-OFF viral injection strategy, representative images (c) and quantification (d) of mCherry-IR (magenta) and GFP-IR (green) from three independent injections of the Flp-ON/Cre-OFF tTARGIT system using an hM3Dq-mCherry transgene into the VMH of Slc17a6FlpO;LeprCre; Rosa26LSL-eGFP-L10a mice (which express GFP in all LeprCre cells). Bottom images show zooms of the boxed regions in the top panels. White arrowheads indicate localization between GFP and mCherry. Data presented as mean± SEM. Scale bars = 100 μm.