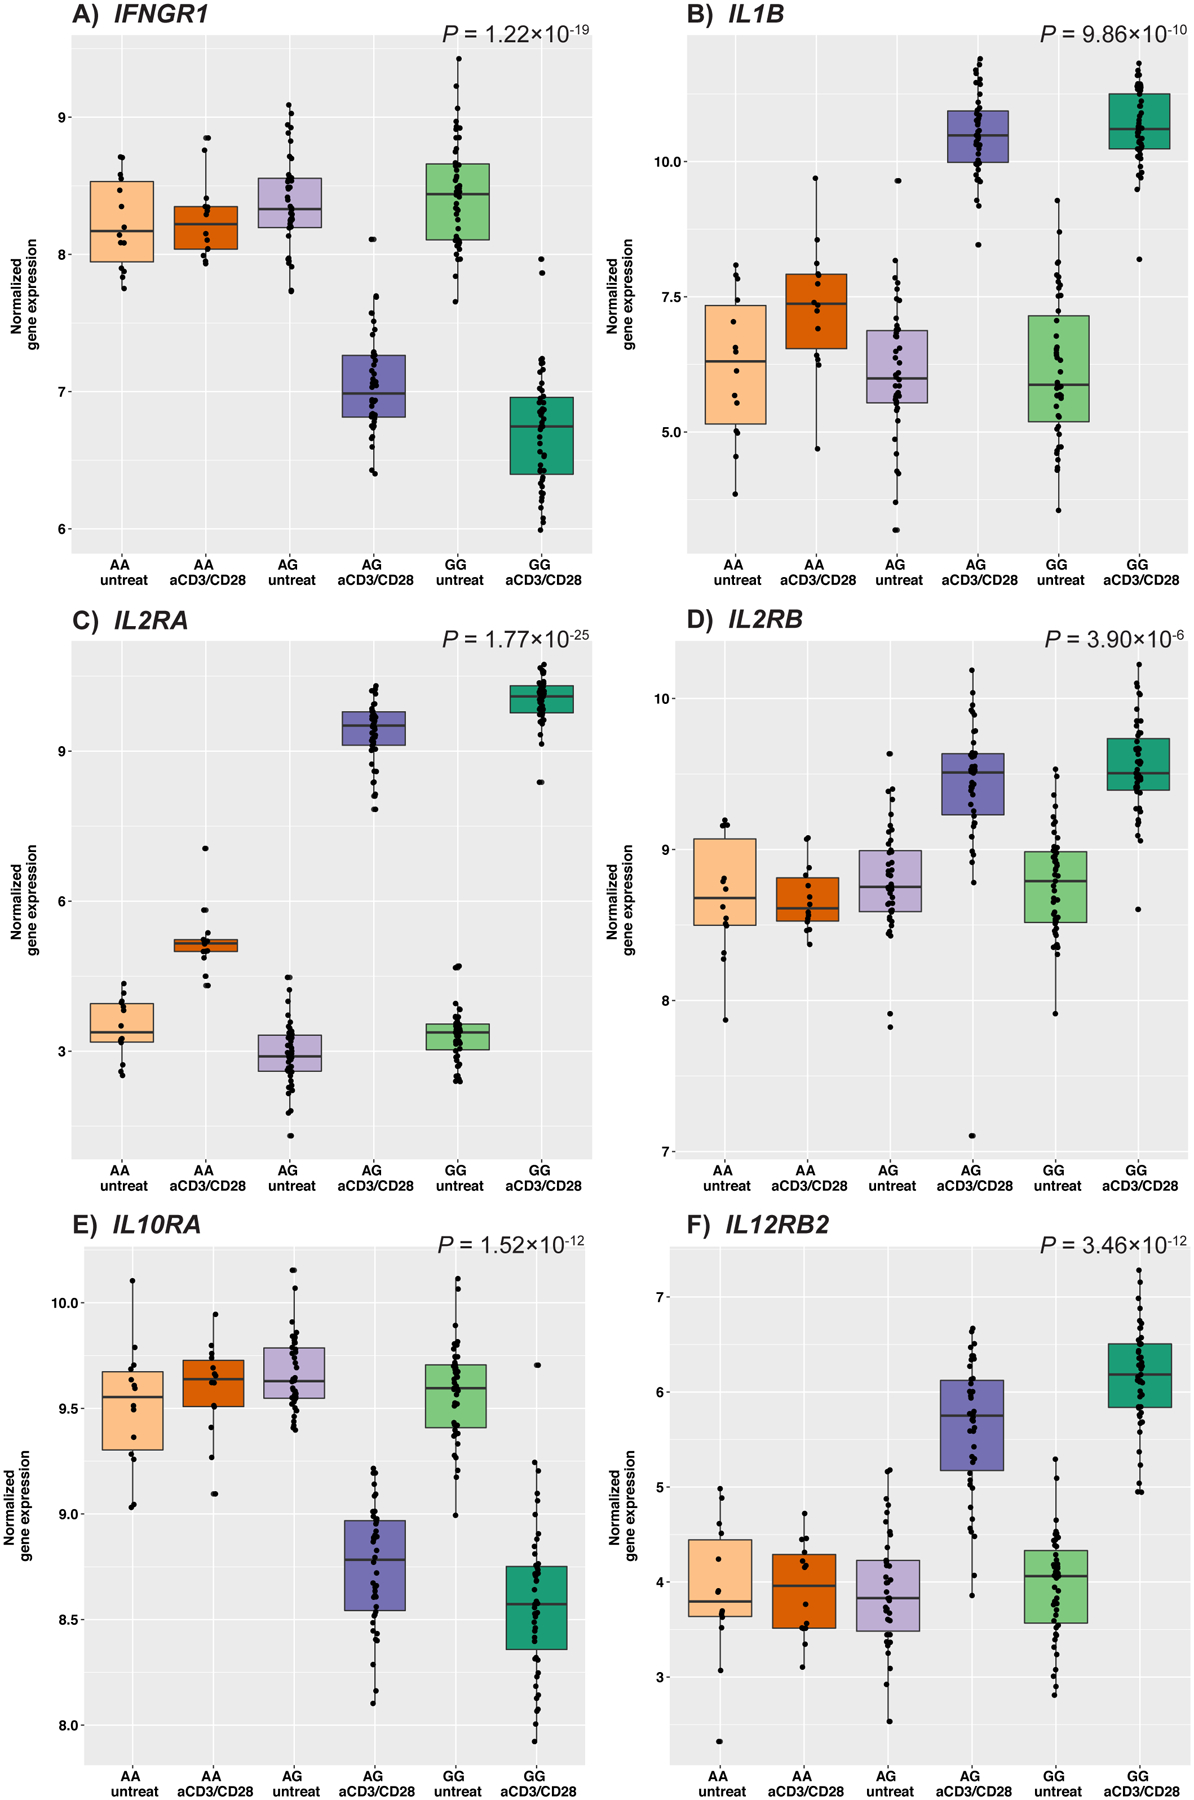
Figure 3. Gene expression of cytokine and cytokine receptor genes in untreated control and anti-CD3/CD28-treated samples, by rs1801274 genotype.

Boxes indicate the interquartile ranges, whiskers represent the 95% confidence intervals. P-values represent the genotype by treatment interaction effect, all genes shown are significant at FDR 5%. (A) IFNGR1, Interferon gamma receptor 1; (B) IL1B, Interleukin 1 beta; (C) IL2RA, Interleukin 2 receptor subunit alpha; (D) IL2RB, Interleukin 2 receptor subunit beta; (E) IL10RA, Interleukin 10 receptor subunit alpha; (F) IL12RB2, Interleukin 12 receptor beta 2 subunit.
