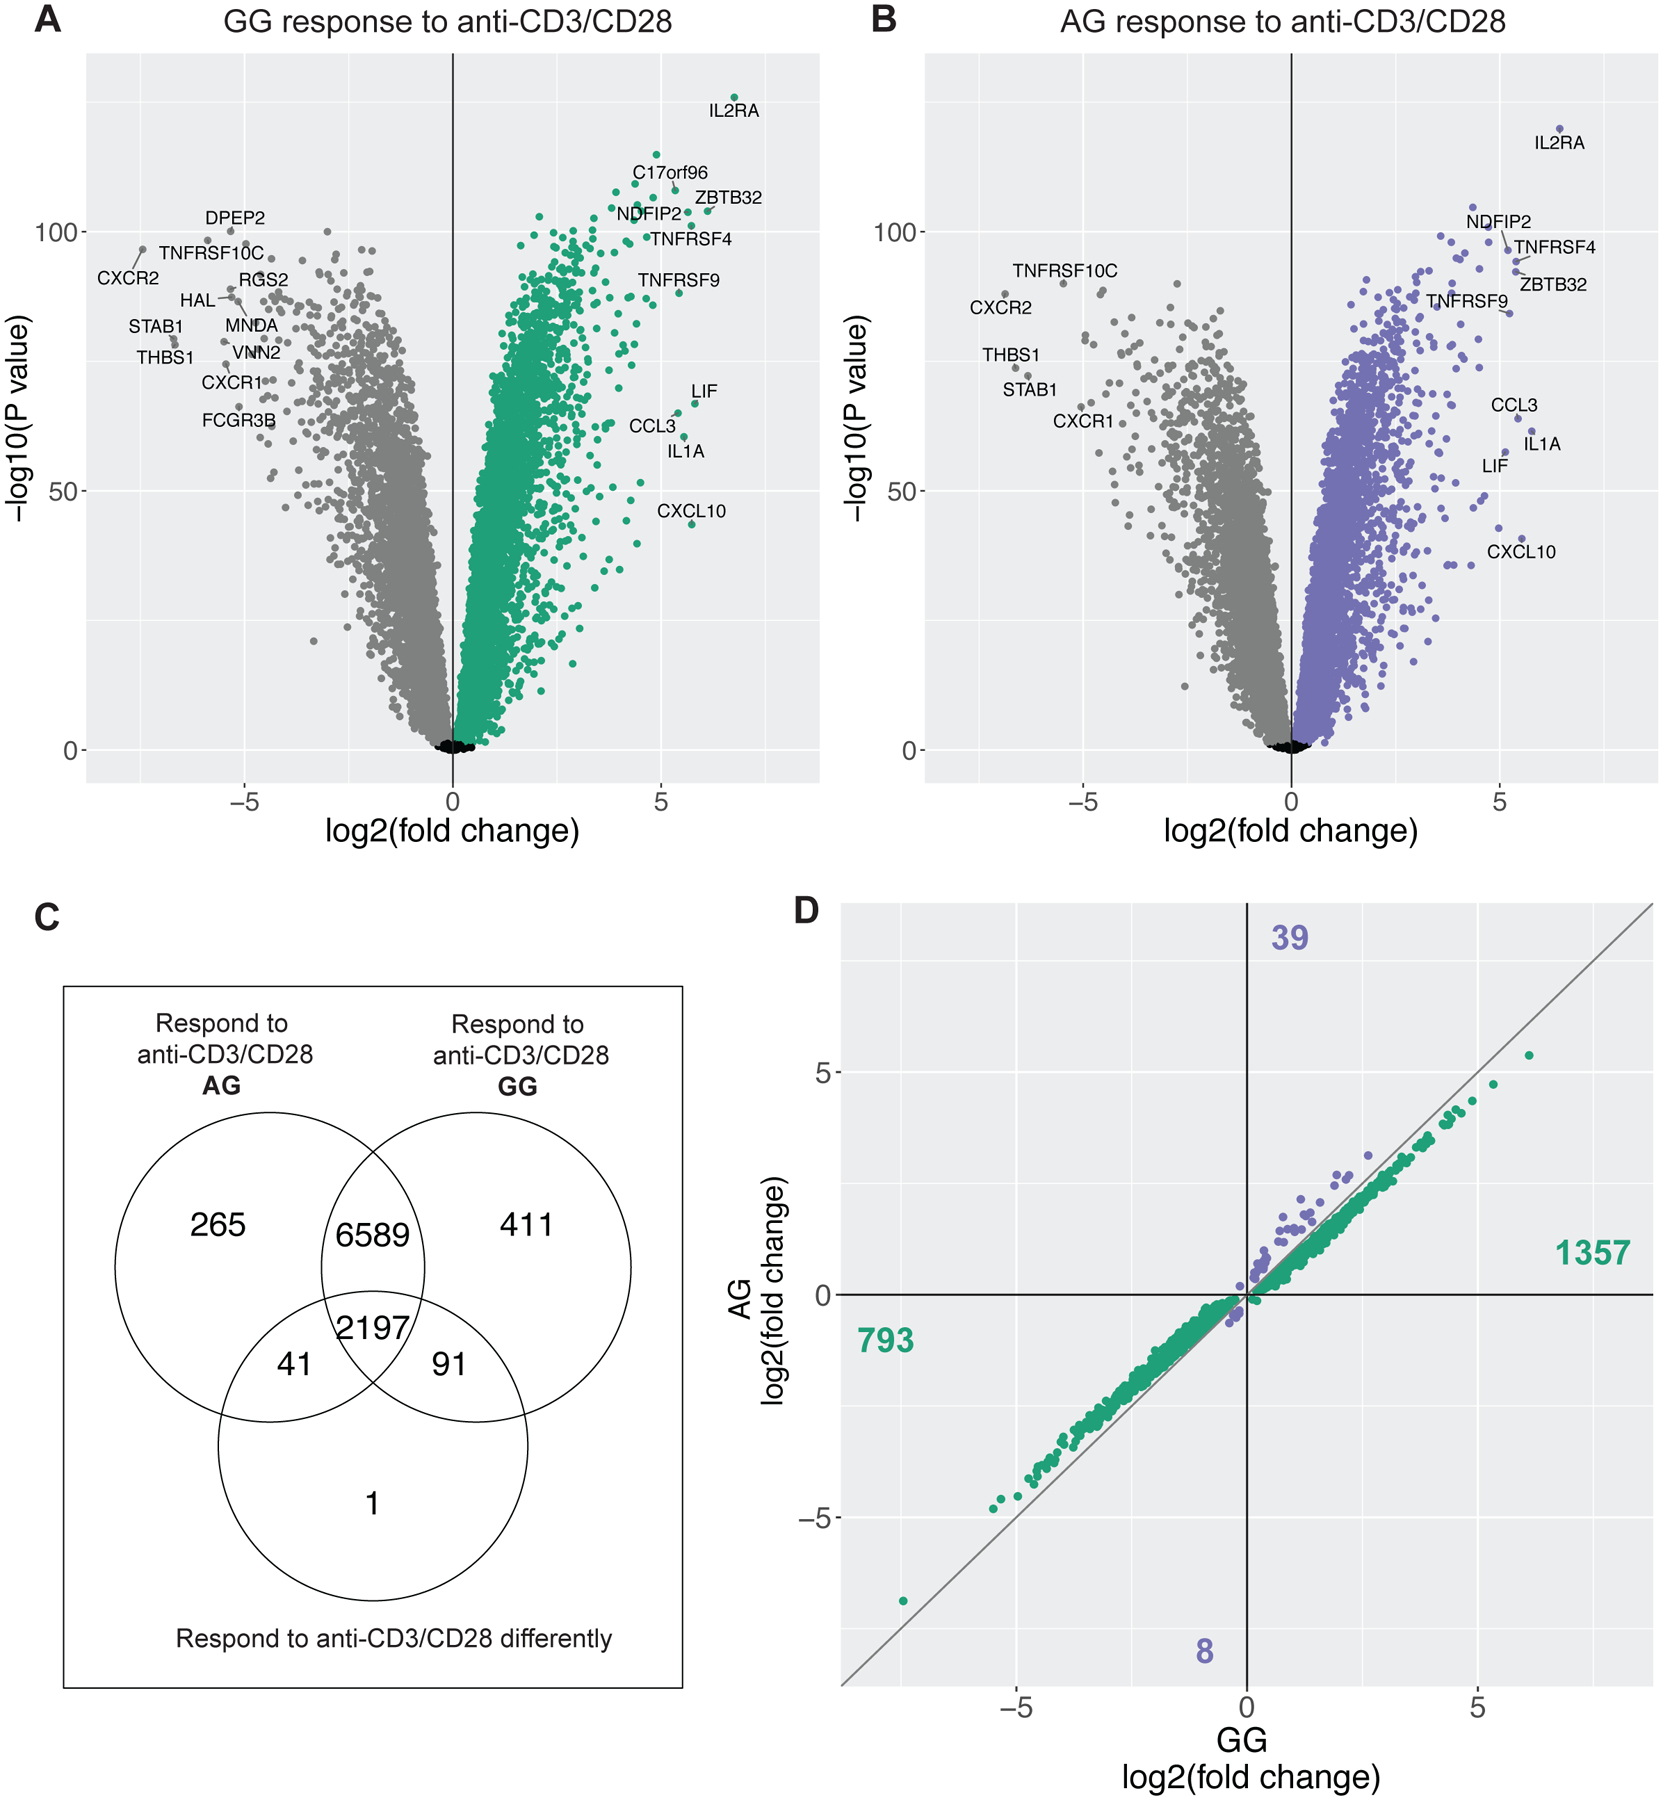
Figure 4. Differences in gene expression response to anti-CD3/CD28-treated whole blood between individuals with the AG (Arg/His) and GG (His/His) genotype at rs1801274 in the FCGR2A gene.

Volcano plot of gene expression response to anti-CD3/CD28 in individuals GG (A) and AG (B) at rs1801274. Each point represents a gene, and genes in gray have significantly decreased expression (FDR 5%) after anti-CD3/CD28 treatment, while genes in green or purple have significantly increased expression following treatment compared to the untreated control. Genes with a log2 fold change <5 or >−5 are labeled in each plot. (C) Venn diagram summarizing the number of genes differentially expressed following anti-CD3/CD28 treatment in GG homozygotes (top left circle), AG heterozygotes (top right circle), and genes that respond differently to treatment by genotype class in the bottom circle ([GG anti-CD3/CD28 - GG untreated] - [AG anti-CD3/CD28 – AG untreated] ≠ 0). (D) Genes that respond differently by genotype class plotted by fold change in GG homozygotes (x-axis) and AG heterozygotes (y-axis). Genes in green have a higher magnitude of response in GG individuals, genes colored purple have a higher magnitude of response in AG individuals. Number of genes listed in each quadrant.
