Figure 1.
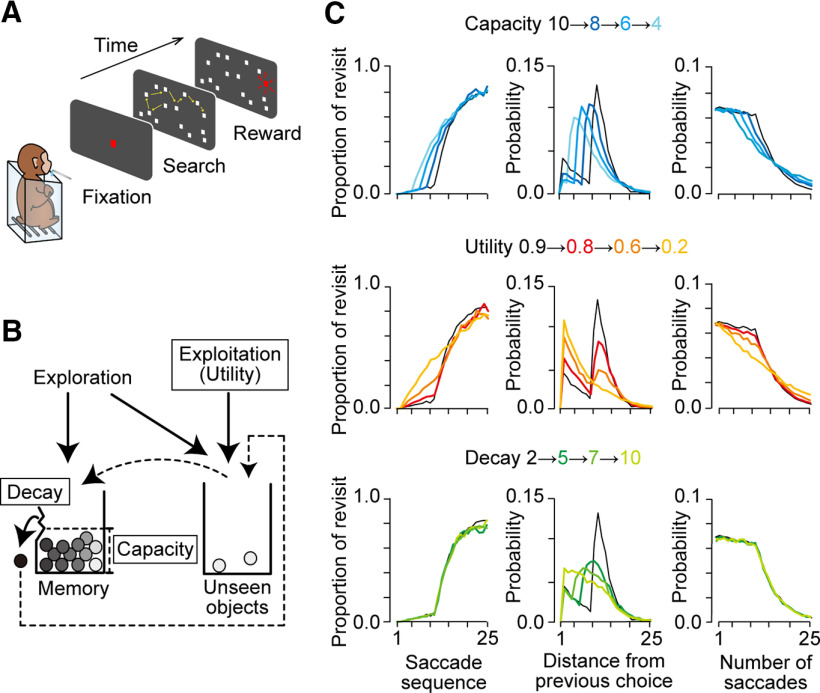
Behavioral task and the foraging model. A, The oculomotor foraging task. Monkeys were presented with 15 identical objects (white squares) on the screen after the initial fixation period. One of the objects was associated with a liquid reward, and animals obtained a reward when they looked at the target for 100 ms within 6 s. As monkeys found the target, it turns red and the trial was terminated. B, A schematic of the foraging model. Each circle represents a single object. During the visual search, the visited item was sequentially registered to the short-term memory and moved from the right box (unseen objects) to the left box (memory). When the number of items reached the memory capacity (12 items in this example), one item in the left box dropped off and moved back to the right box. The order of memory loss was defined by the memory decay and smaller number indicated better retention of short-term memory. In the exploration mode, the item was randomly chosen from 14 objects (except for the currently fixated object) with no reference to WM. Thus, the model was defined by three parameters: memory capacity, memory decay, and utility rate. C, Model prediction derived from Monte Carlo simulations. Each column plots the relationship between saccade sequence and proportion of revisiting behavior (left), relative frequency of revisiting behavior as a function of the number of intervening saccades (distance) from the previous choice (middle), and relative frequency of saccade number in each trial. Each row compares the predictions for different memory capacities (top), utility rates (middle row), and memory decays (bottom). In all panels, the black traces indicate the data obtained from the model with memory capacity of 10, utility rate of 0.9, and memory decay of 2.

