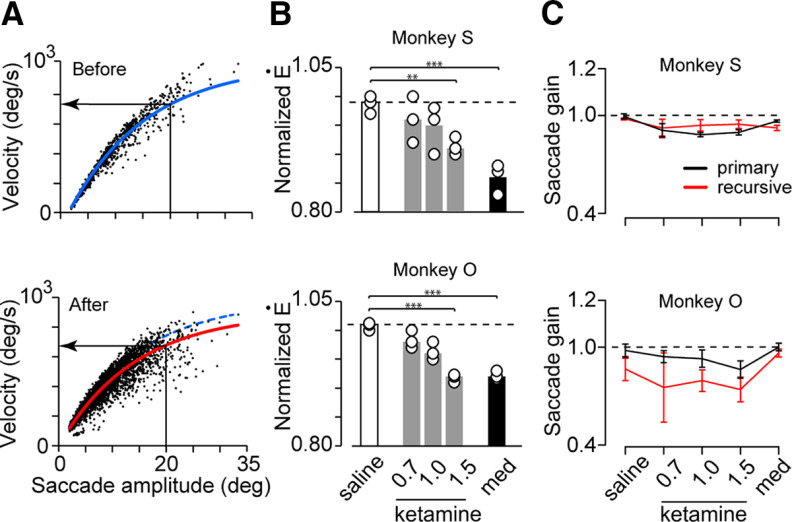
Figure 4.
Effects of ketamine administration on saccade velocity and amplitude. A, Relationships between saccade amplitude and peak velocity (main sequence) before (top panel) and 60 min following ketamine administration (1.5 mg/kg, bottom) in monkey S. Blue and red solid lines show the best-fit exponential curves (least squares) for the preinjection and postinjection data, respectively. The blue dashed curve in the bottom panel duplicates the one in the top panel for comparison. The leftward arrow indicates the estimated peak velocity for the 20° saccade. B, Peak velocity following intramuscular injection of saline or drugs (0.7, 1.0, and 1.5 mg/kg ketamine and 0.01 mg/kg medetomidine) normalized for the preinjection data. The circles indicate individual experiments and bars denote the means of three sessions; **p < 0.01, ***p < 10−3 for multiple comparisons (Dunnett’s tests compared with saline). C, Gains of primary (black) and recursive (red) saccades. Error bar indicates 1 SD for sessions.

