
Figure 1.
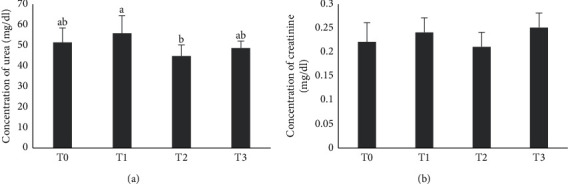
The concentration (mean ± SD) (n = 6) of urea (a) and creatinine (b) after administration of neem leaf ethanolic extracts in male rats. Different superscripts indicate a statistically significant difference between groups (p < 0.05). T0 = control group, T1 = 100 mg/kg treated group, T2 = 200 mg/kg treated group, and T3 = 300 mg/kg treated group.