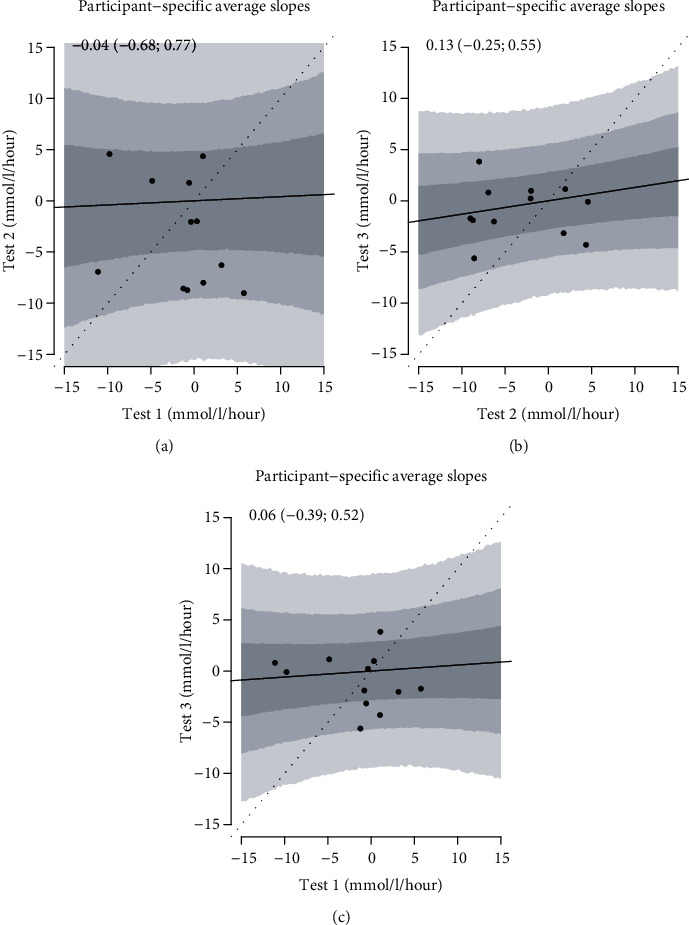
Figure 3.

The figure shows the participant-specific capillary glucose average slopes in tests 1 and 2 (a), tests 2 and 3 (b), and test 1 and test 3 (c). The regression line is the relationship between average slopes across trials, and the gray regions are 50%, 80%, and 95% confidence intervals. If the tests had elicited identical glucose changes, all points had been on the dashed identity line. The values at the top are the slopes of the regression lines with 95% confidence intervals.
