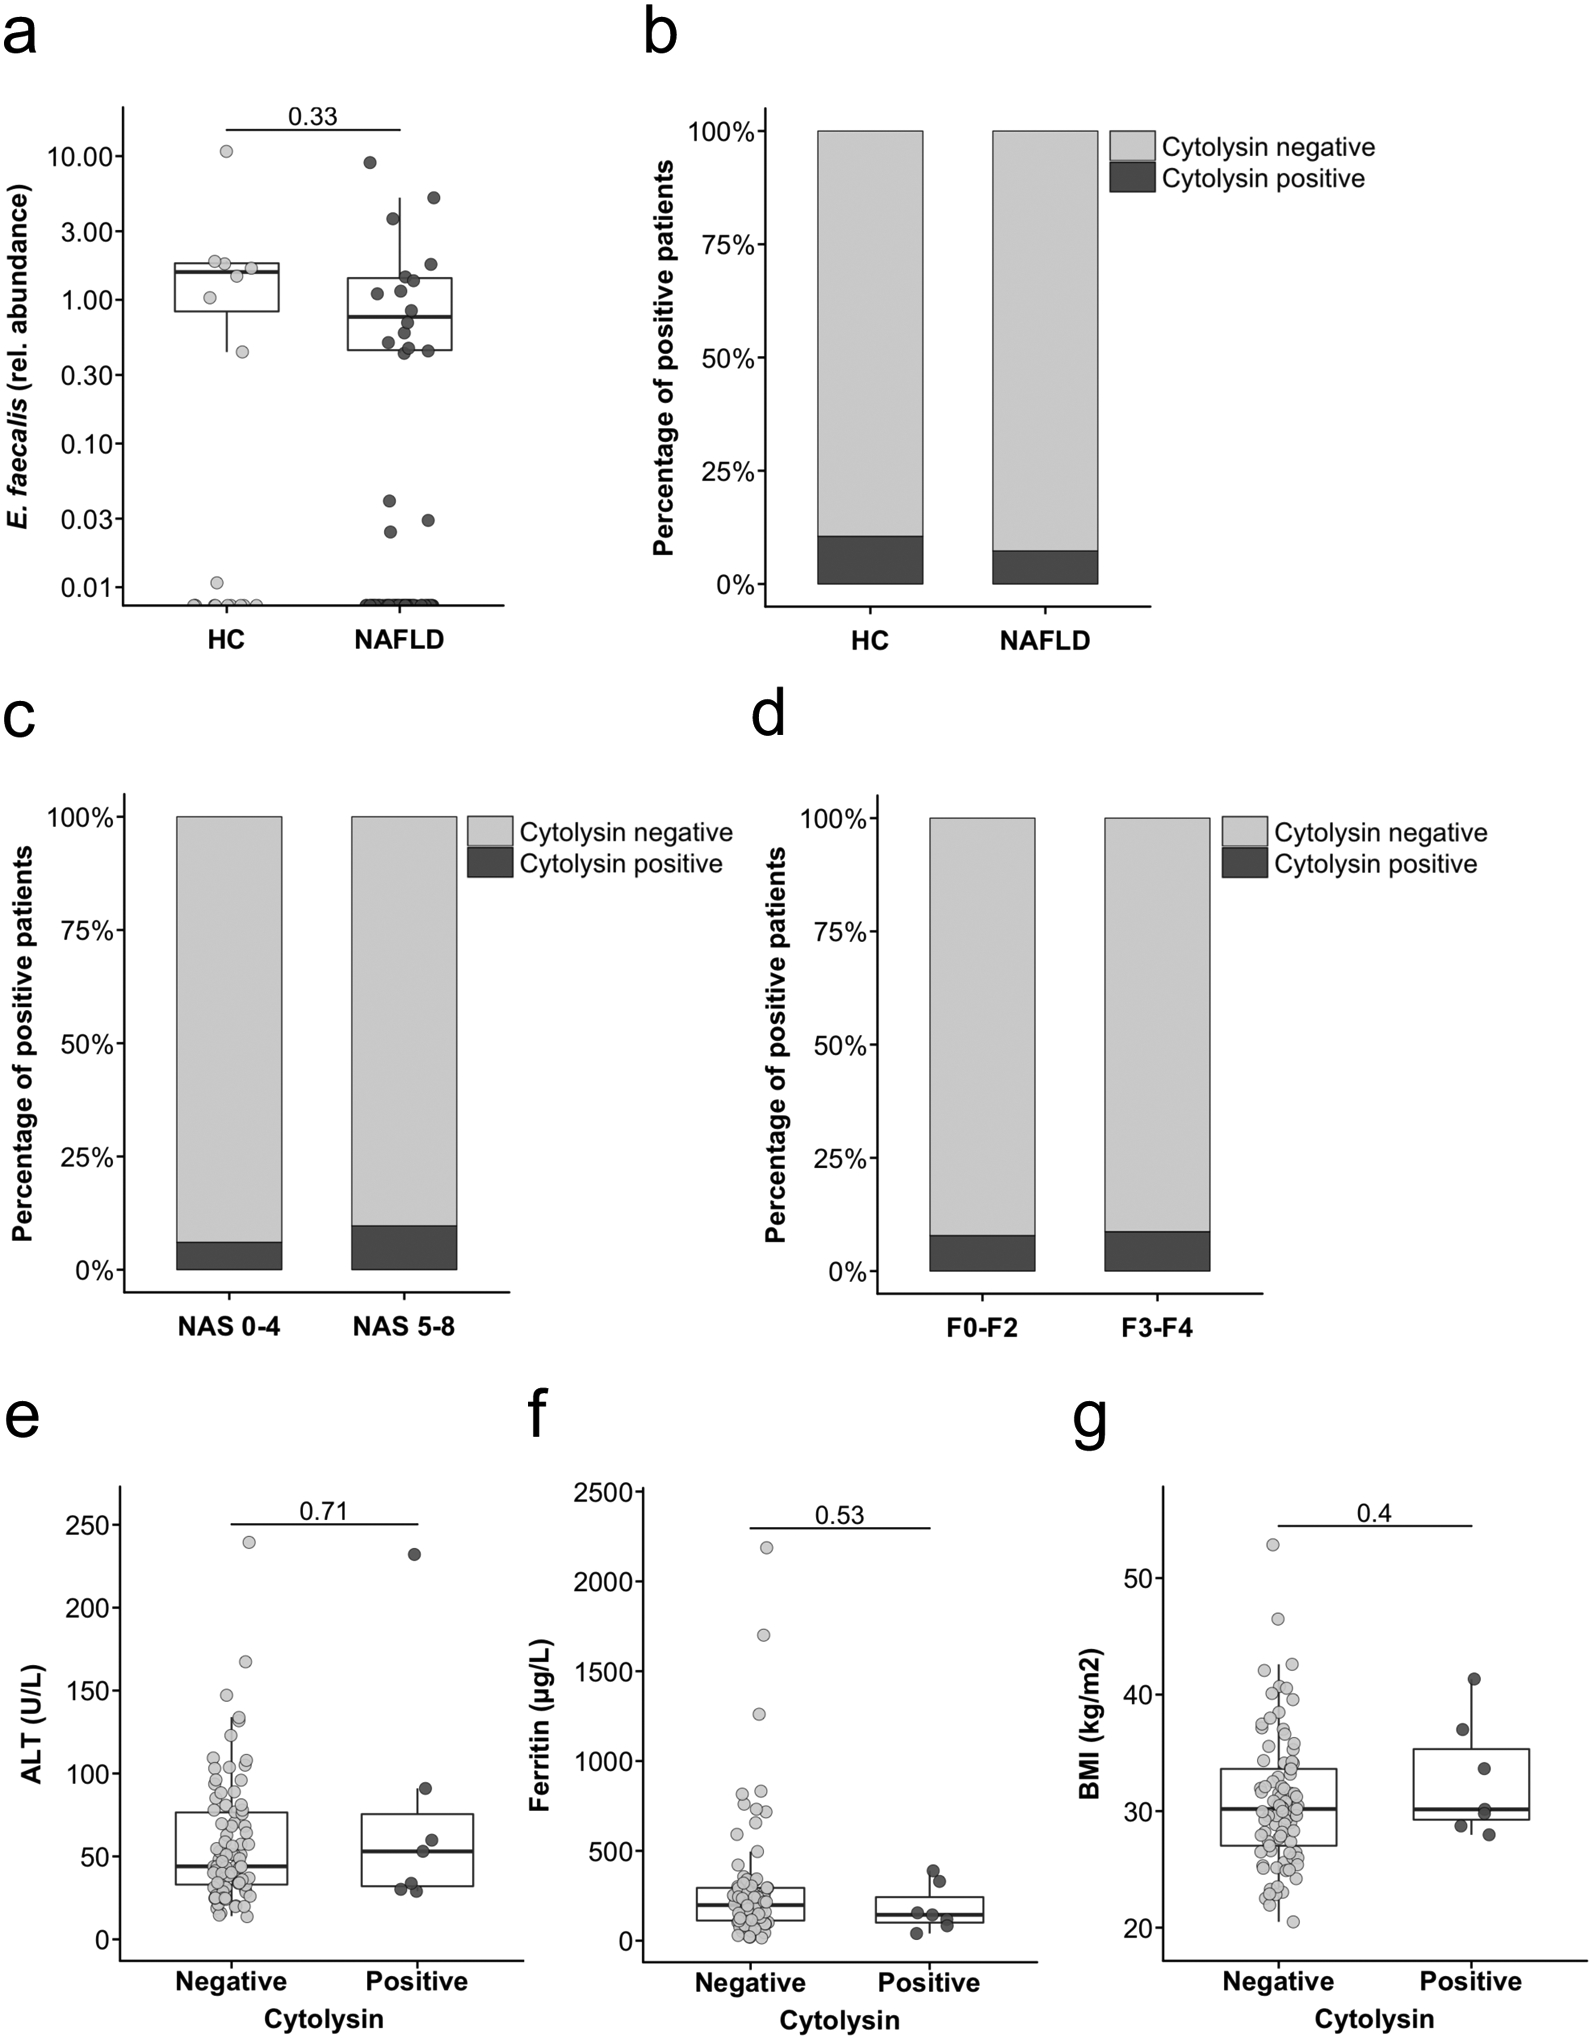
Figure 1. Association of faecal cytolysin-positivity with disease activity in NAFLD patients.

(a) E. faecalis in faecal samples from healthy controls (n=19) or NAFLD patients (n=96), assessed by qPCR. (b) Proportion of cytolysin-positive faecal samples among 19 healthy controls and 96 NAFLD patients. P=0.64. (c) Proportion of cytolysin-positive faecal samples among 64 biopsy proven NAFLD patients. 31 of these patients had definite non-alcoholic steatohepatitis (NASH). NASH was defined as NAFLD activity score (NAS) of 5–8 on liver biopsy. P=0.67. (d) Proportion of cytolysin-positive faecal samples among 51 NAFLD patients with no to moderate (F0-F2) versus 23 patients with advanced (F3-F4) fibrosis. P=1. In 10 of these patients, NASH-cirrhosis was diagnosed based on clinical findings (see Methods). (e) Comparison of alanine amino-transferase (ALT) levels between 87 cytolysin-negative and 7 cytolysin-positive NAFLD patients. (f) Comparison of total ferritin levels between 83 cytolysin-negative and 7 cytolysin-positive NAFLD patients. (g) Comparison of body mass index (BMI) between 89 cytolysin-negative and 7 cytolysin-positive NAFLD patients. Two-sided Fisher’s exact test (b,c,d) or Mann-Whitney-Wilcoxon rank-sum test (a,e,f,g). For the box and whisker plots in a,e,f and g, the box extends from the 25th to 75th percentiles, and the centre line represents the median. The upper whisker extends from the box to the largest value no further than 1.5 * IQR from the box (where IQR is the inter-quartile range, or distance between the first and third quartiles). The lower whisker extends from the box to the smallest value at most 1.5 * IQR of the box. Data beyond the end of the whiskers are plotted individually.
