
Figure 4.
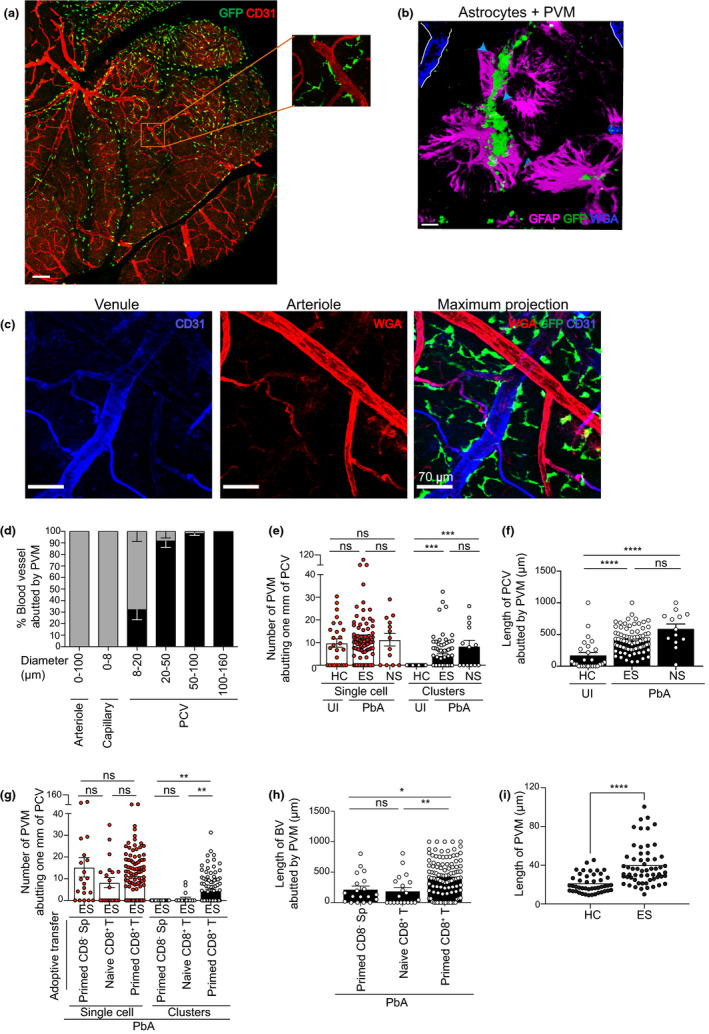
Phenotypic characterisation and distribution of PVM during ECM. (a) Tile scan image of the top of the brain in UI DPE‐GFP mice using confocal microscopy. Scale bar 340 μm. (b) PVM intercalated with GFAP, an intermediate filament protein produced by astrocytes (glia limitans). Scale bar 110 μm. (c) PVM closely abuts the length of large PCV (blue) but not arterioles (red) or capillaries (red mixed with blue). Scale bar 70 μm. a–c are representative of 2 or 3 independent experiments (n = 3). (d) 2P‐IVM of the cerebral vasculature during ES. Grey bars indicate 0, and black bars ≥ 1 indicate PVM abutting the length of a blood vessel. 171 blood vessels from 4 independent experiments (n = 8). Bars represent mean ± SEM. 2P‐IVM was performed on DPE‐GFP (e, f) and DPE‐GFPxRAG‐1−/− (g, h) mice. Number of PVM was quantified manually. Clusters were defined as cell area that is at least twofold more than that of UI mice. Error bars represent mean ± SEM. ns, not significant, **P < 0.001, ***P = 0.0001, ****P < 0.0001 (ANOVA, Kruskal–Wallis test). Data are pooled from 2 (HC), 7 (ES), 3 (NS), 2 (primed CD8− Sp), 3 (naïve CD8+ T) or 5 (primed CD8+ T) mice. 13–104 PCV from at least 2 independent experiments. NS is one experiment. (i) Length of PVM abutting PCV (n = 4), 2 independent experiments.