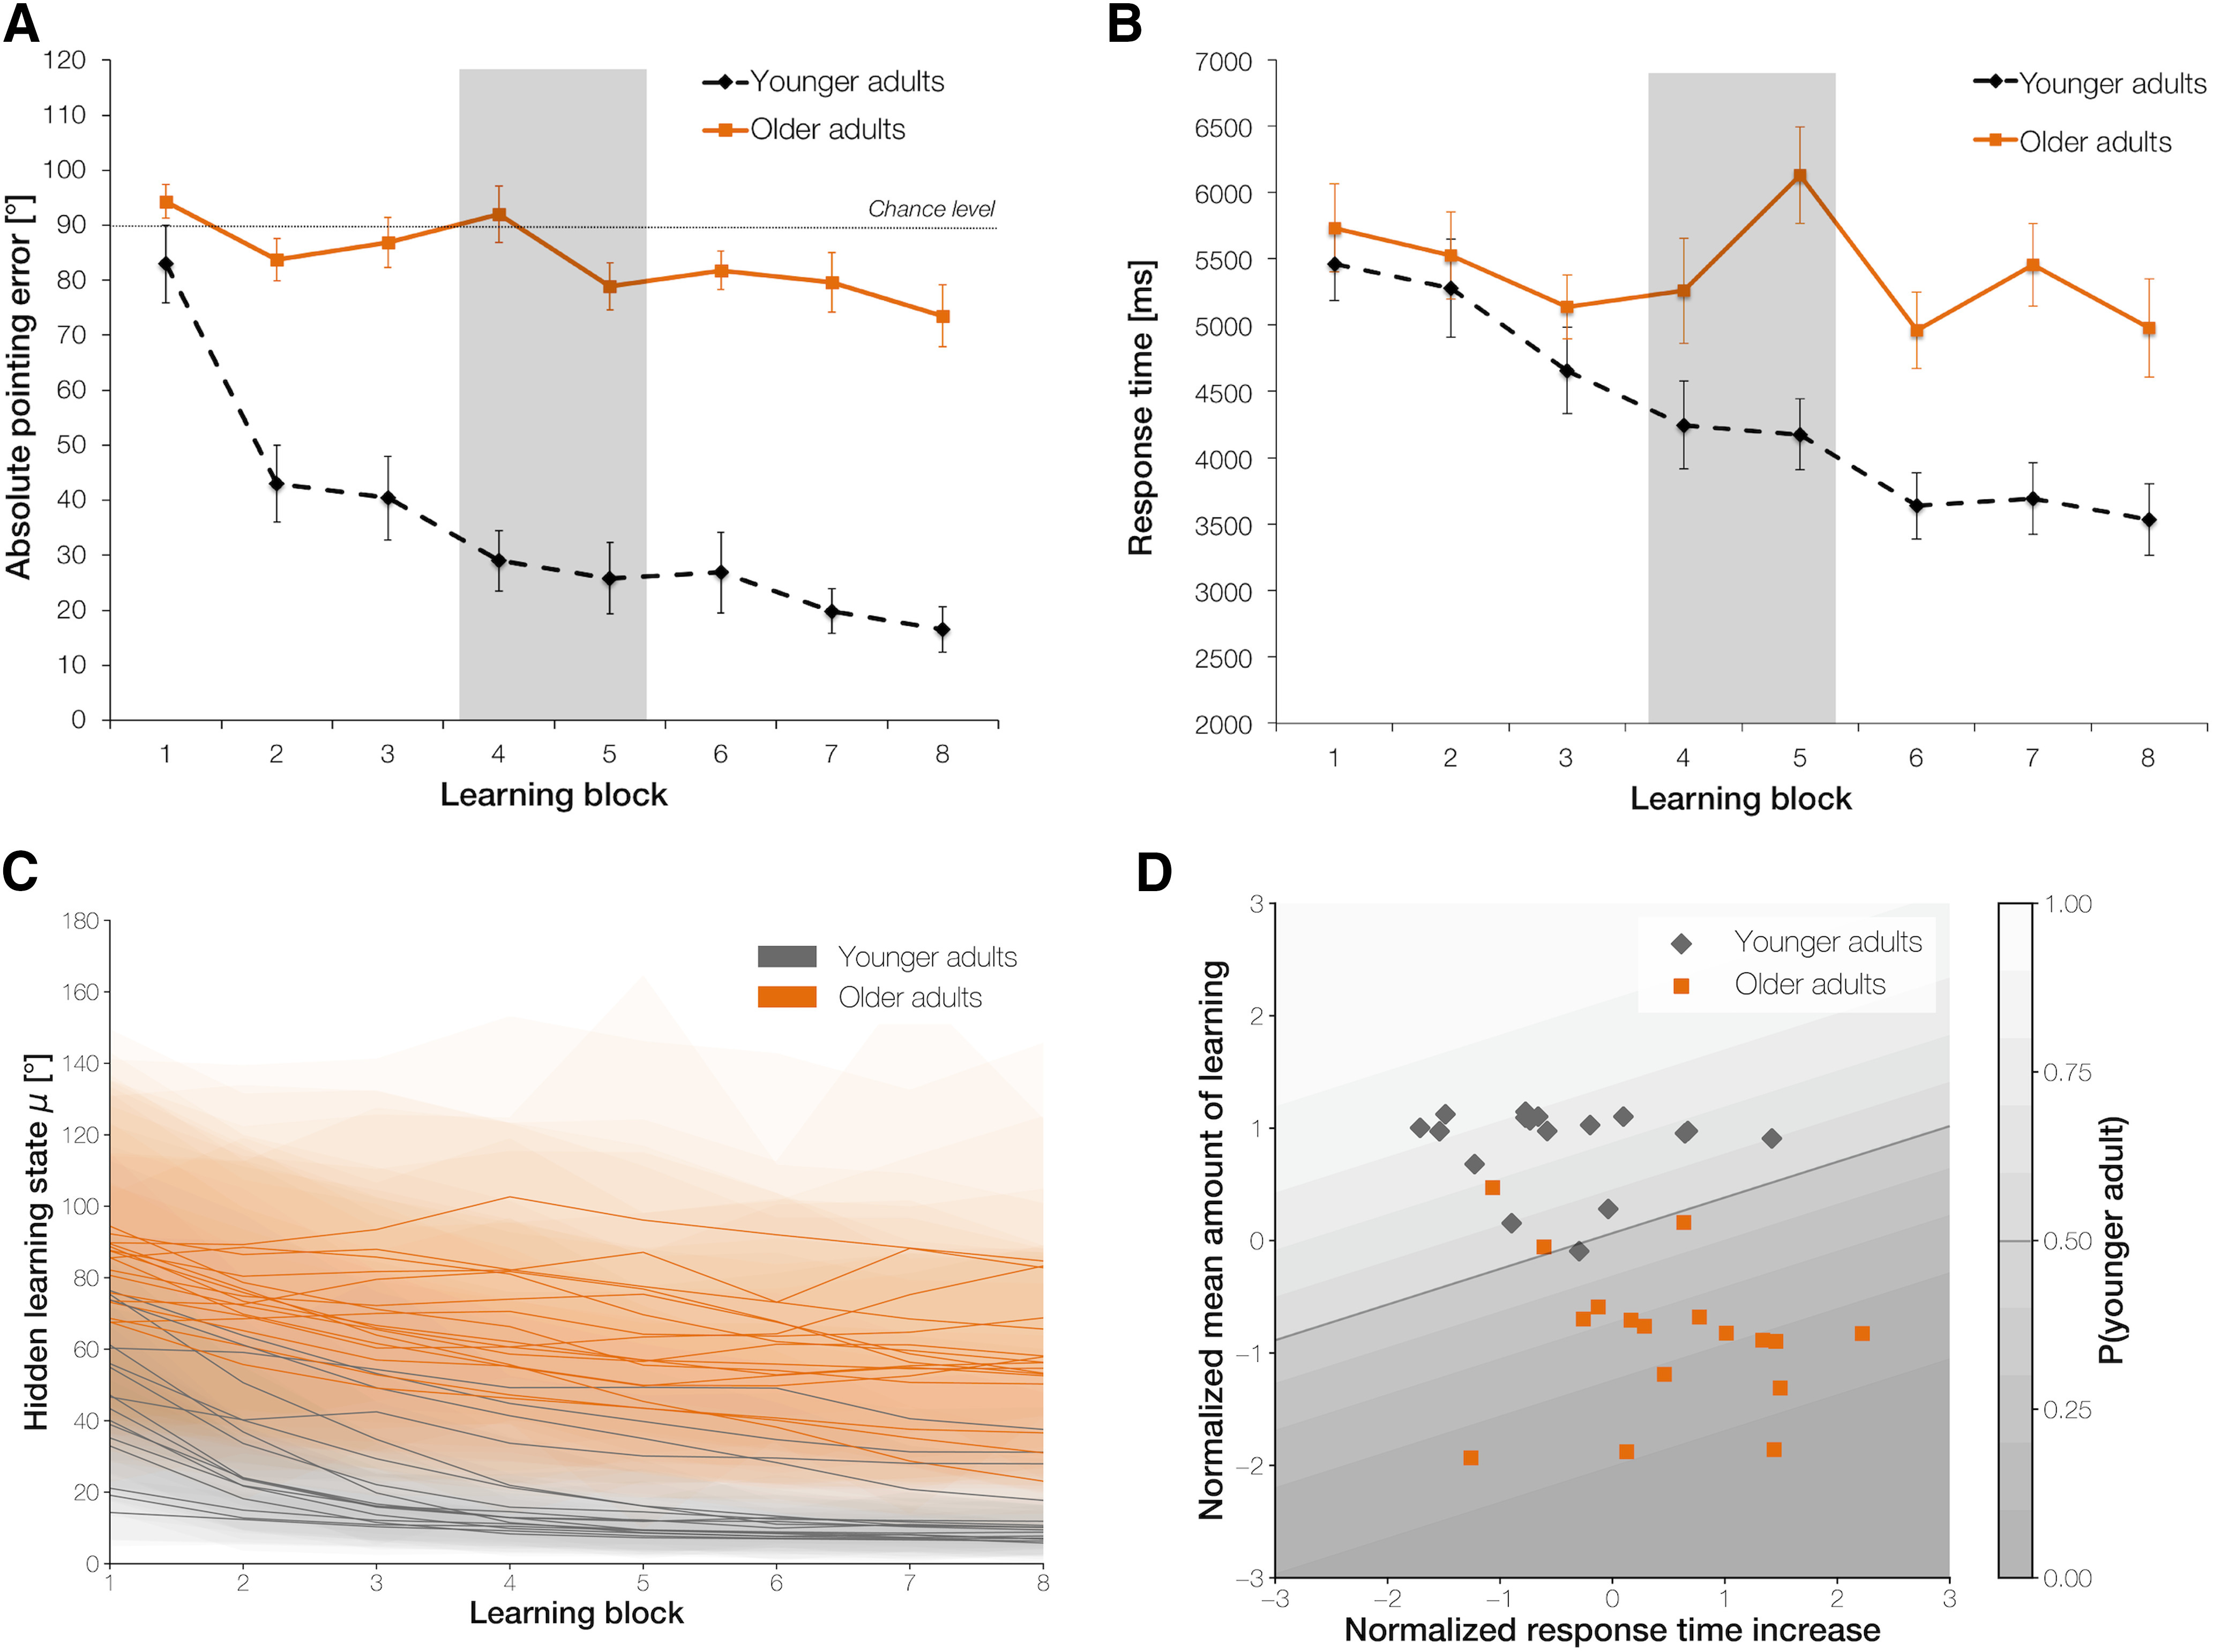
Figure 3.

Performance data in the behavioral experiment. A, Average absolute pointing errors and (B) response times across the eight learning blocks in older (solid line) and younger adults (dashed line; highlighted in gray is the fourth and fifth learning block where the change in directions took place from which the intersections were approached). Error bars denote SEM. See also Extended Data Figure 3-1A,B for average pointing errors per learning block for each participant in each age group. C, Mean estimated performance improvement (hidden learning state) of each participant in the older (orange) and younger (gray) age group, including the SD of the posterior distributions (shaded area) across learning blocks. D, Logistic regression results classifying age group membership based on two behavioral performance features, i.e., the mean amount of learning across the experiment and the increase in response times after the first half of the experiment. Shaded lines depict the probability of being classified as a younger adult.
