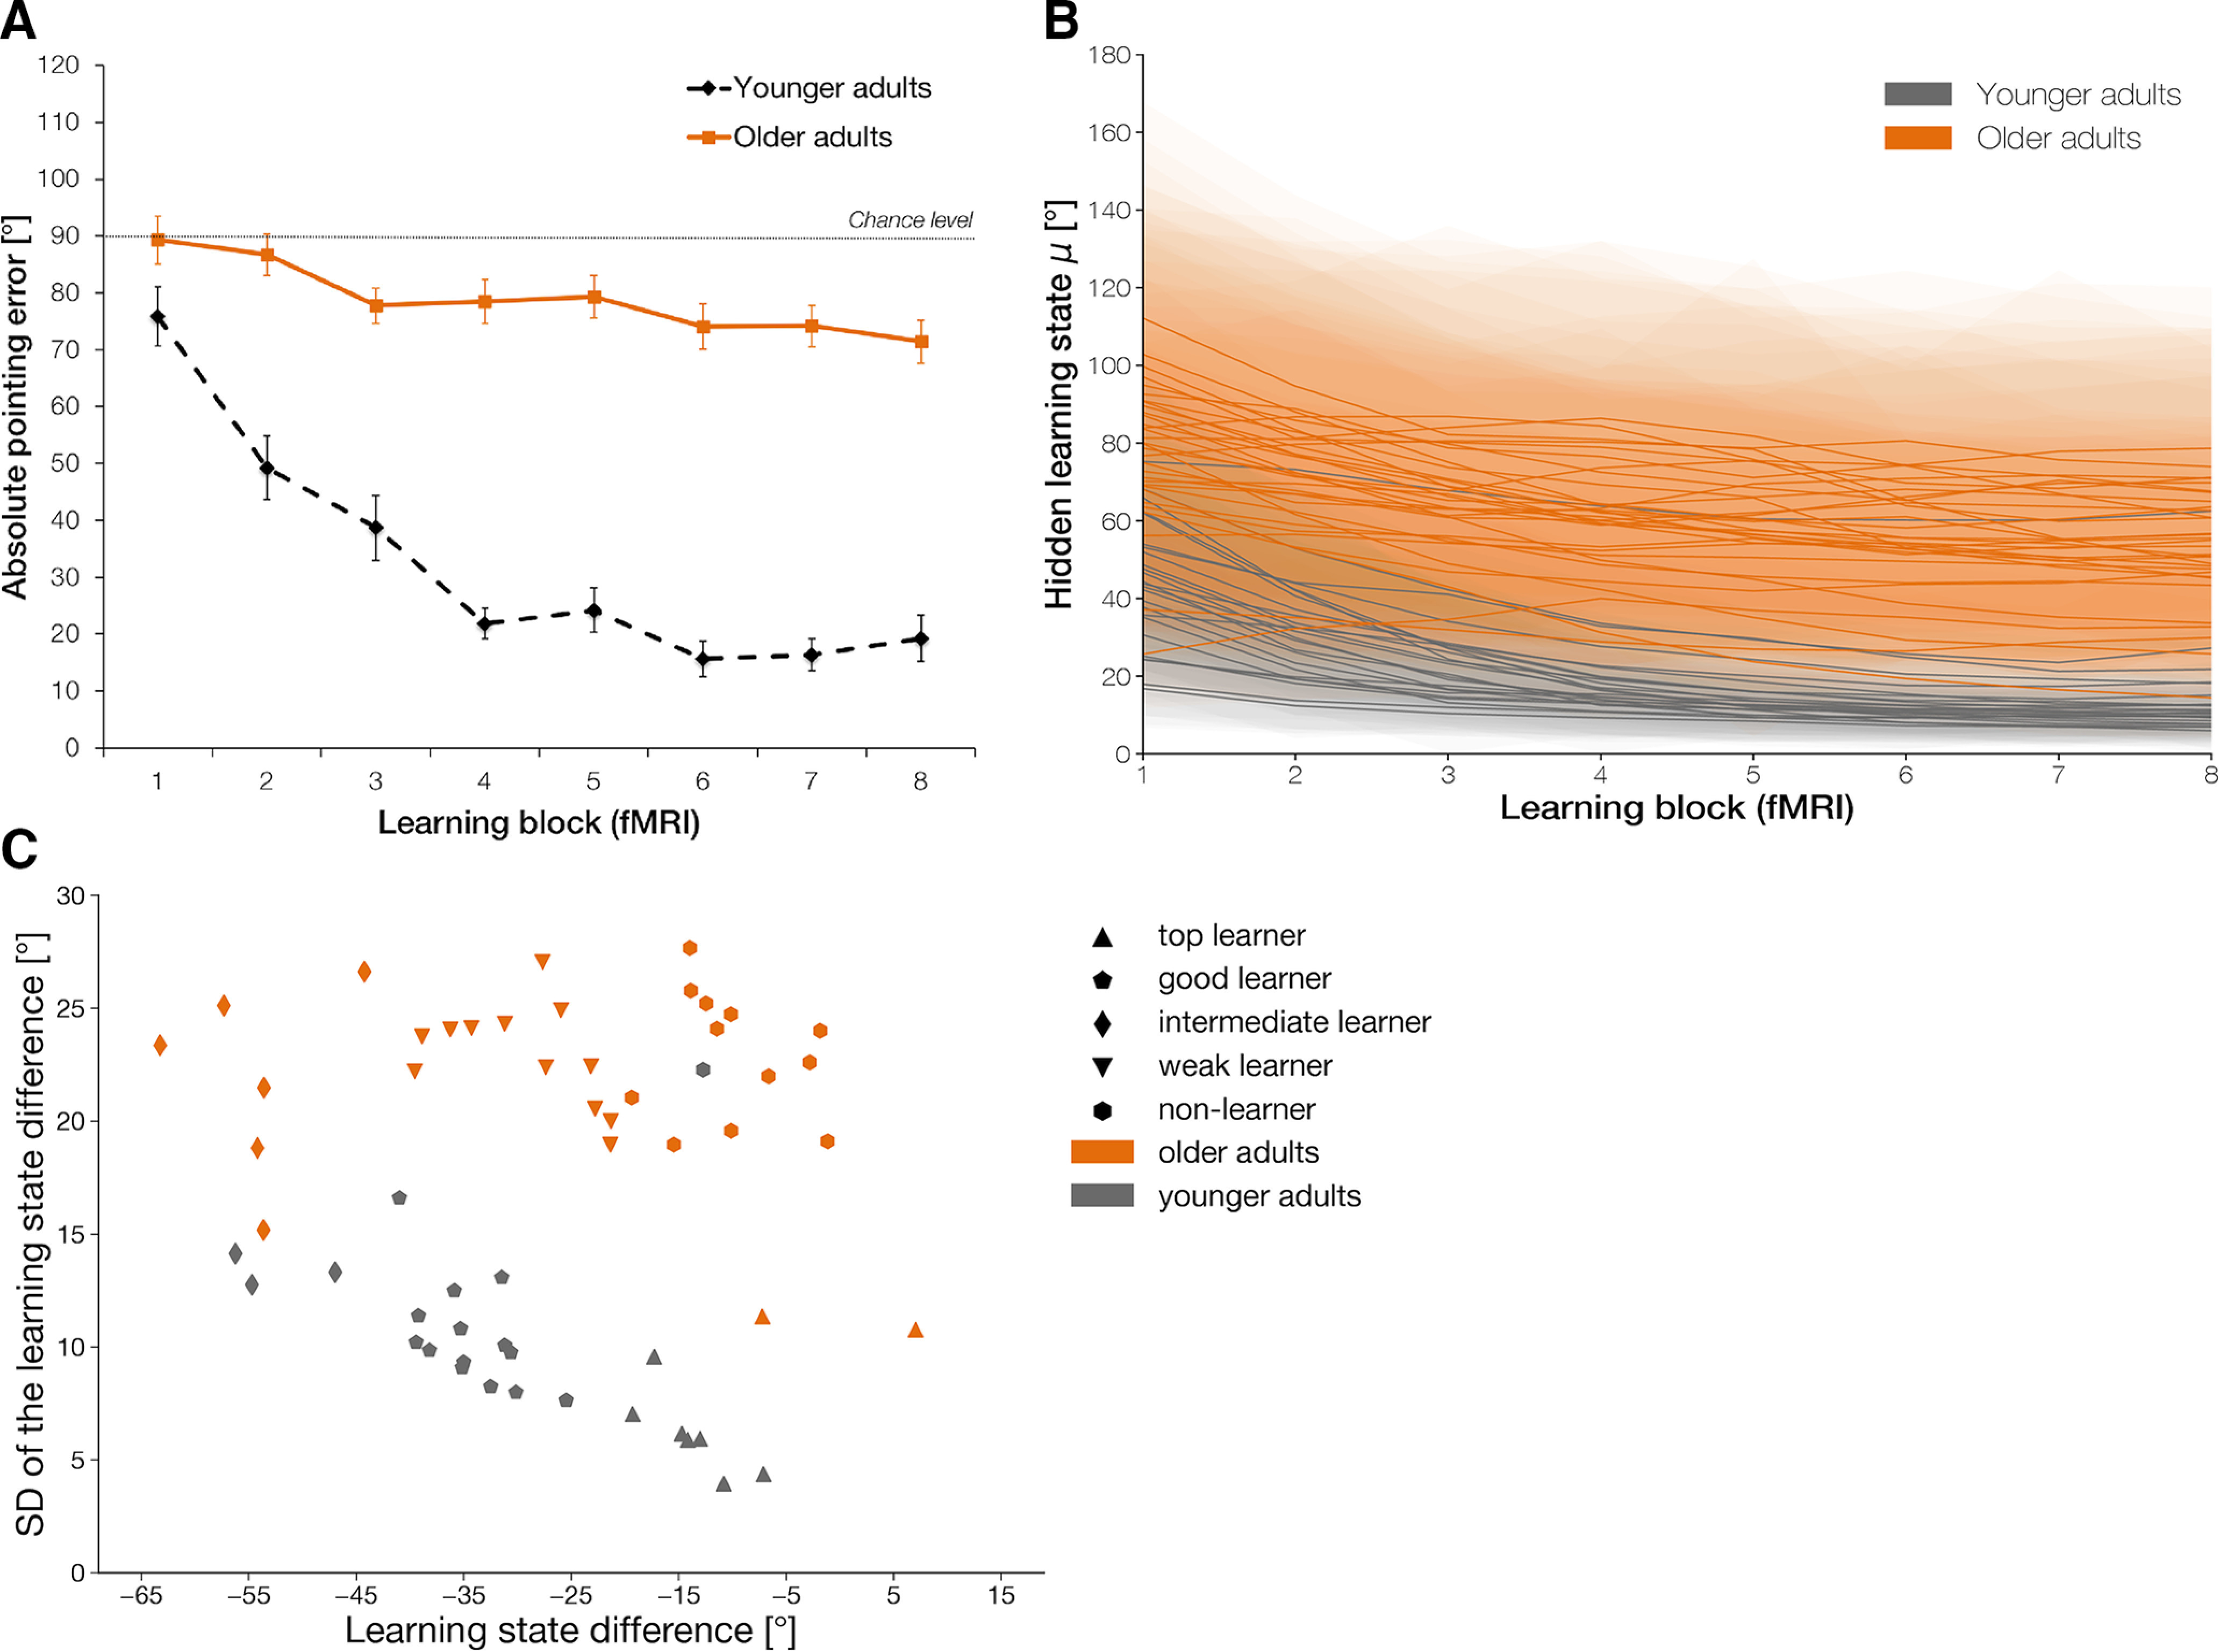
Figure 4.

Performance data in the fMRI experiment. A, Average absolute pointing errors across the eight learning blocks in older (solid line) and younger adults (dashed line). Error bars denote SEM. See also Extended Data Figure 3-1C,D for average pointing errors per learning block for each participant in each age group. B, Mean estimated performance improvement (hidden learning state) of each participant in the older (orange) and younger (gray) age group, including the SD of the posterior distributions (shaded area) across learning blocks. C, Learning subgroups as identified by a K-means clustering algorithm based on the individuals' overall amount of learning and its SD, as determined by the difference of the latent state distributions of the last and first learning block. See Extended Data Figure 4-1 for difference distributions, learning state estimates, and performance data per learning block for representative individuals from each learning subgroup and Extended Data Figure 4-2 for the results of the same clustering analysis within the sample of the behavioral experiment.
