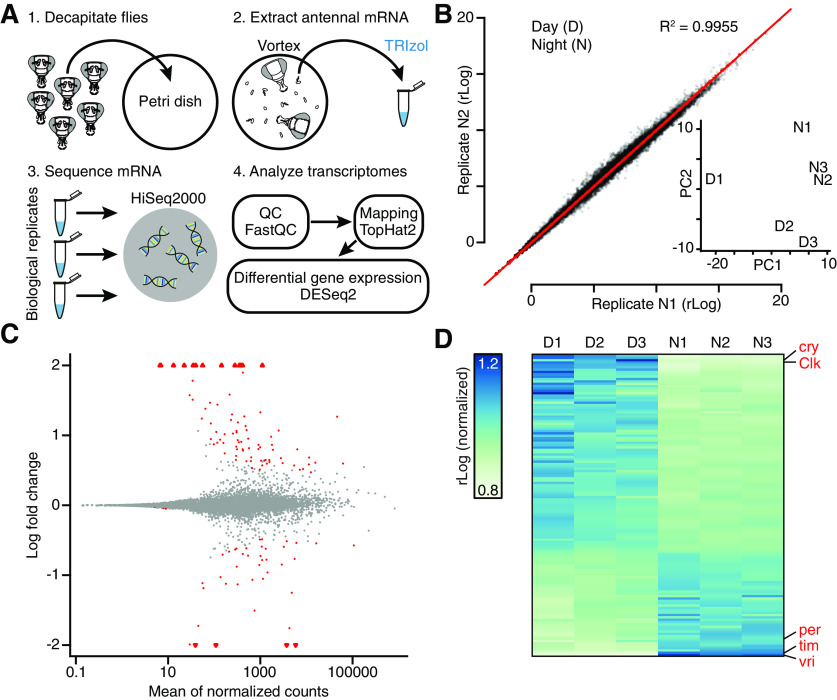
Figure 1.
Antennal transcriptomics: workflow, diagnostics, and functional validation. A, Experimental workflow. B, Scatterplot of gene expression levels in biological replicates N1 versus N2. Inset, D and N samples in a principal component analysis (PCA) plot. C, MA plot of log2 fold change in expression (M) versus mean expression level (A) of all transcripts. Triangles represent data points outside the plotted range. D, Expression levels of all transcripts with FDR-adjusted p < 0.20 during the day and night. Each column represents a sequencing library generated from third antennal segments. Red type indicates core clock components.

