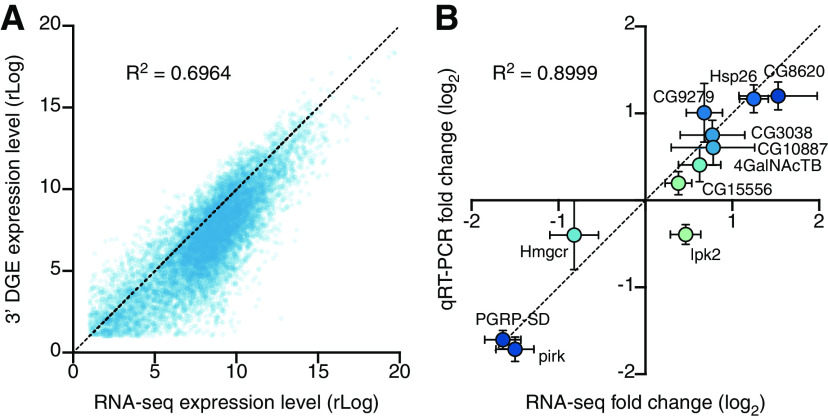
Figure 5.
Cross-validation of differential gene expression. A, Scatterplot of average gene expression levels determined by RNA-seq versus 3′ DGE. B, Scatterplot of log2 fold changes (mean ± SEM) in the expression levels of 11 transcripts after 96 h induction of Kir2.1, determined by RNA-seq or qRT-PCR.

