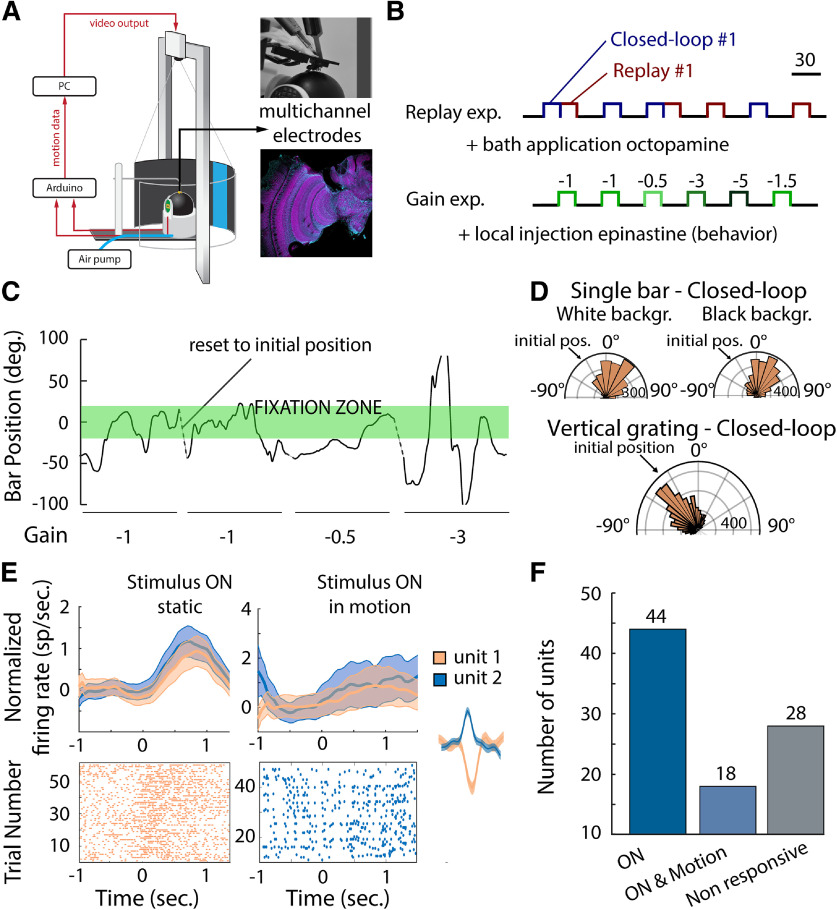
Figure 1.
A, Virtual reality environment (adapted from Rusch et al., 2017). A custom-made 3D-printed holder was glued to the head and thorax of the honeybee to prevent head motion, perfuse the brain with saline solution, and ensure walking behavior (insert, top right). The multichannel tetrodes were inserted using a micromanipulator in the medulla of the honeybee, and the reference electrode was lowered into the saline bath near the tetrode. Placement of the electrodes was verified after the experiment (insert, bottom right). B, Experimental series: the replay experiment consisted in presenting to the honeybee a single bar in closed loop for 20 s and subsequently presenting the replay of the visual stimulus motion in open loop. A black screen was presented to the honeybee between trials, and presentations were randomized so that a replay trial did not necessarily follow a closed-loop trial. This experiment series was paired with multichannel electrode recording and bath application of OA agonist. The second experimental series, the gain experiment, consisted in presenting a single bar to the honeybee at different levels of motor gain. This series of experiments was paired with local injection of epinastine, an OA antagonist, into the medulla. C, Single-bar position on the screen during closed-loop trials at different levels of motor gains. The honeybee tends to fixate on the visual stimulus [fixation zone (−20° to 20°), green rectangle] but fails to do so at the highest level of motor gain (−3). D, Position on the screen of the vertical single-bar position over a white or a black background (top) and of the vertical grading (bottom) during closed-loop trials. When presented with a single visual stimulus, honeybees fixated on it, and this behavior was not found when presented with a vertical grating (Watson–Williams test; distribution of angles single bar vs grading, p < 0.001). The fixation to a single visual stimulus did not depend on the background (Watson–Williams test; distribution of angles white vs black background, p = 0.22). E, Neuronal activity in responses to visual stimulus (normalized mean firing rate and SEM, top; raster plot, bottom; static stimulus, left; stimulus in motion, right). The insert corresponds to the spike waveform of the corresponding unit. F, In total, 90 units were extracted from the neuronal recordings. 44 responded to the presentation of a static visual stimulus, 18 responded to the presentation of a moving visual stimulus, and 28 did not respond to any of the visual stimuli presented. From the 62 responsive units, 7 were excluded from the analysis because of changes in activity over the course of the experiment.

