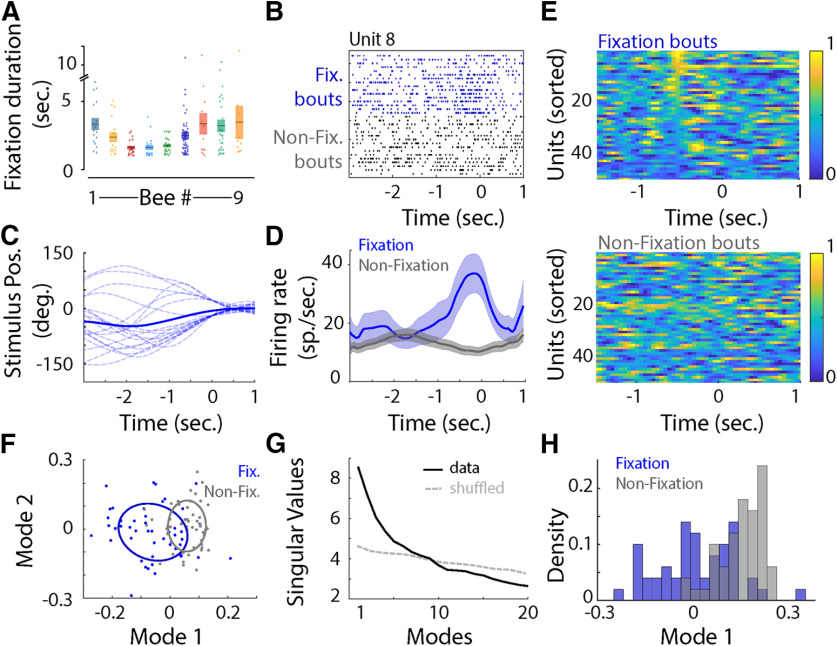
Figure 5.
A, Duration (in seconds) of fixation bouts for each bee. The mean ± SEM is represented by a rectangle. B, Raster plot of the response of a unit before (−3 s) and during fixation (Fix.), or when the bee was not fixating (Non-Fix. bouts). Note the increase in firing rate just before fixation. C, Position of the stimulus on the screen (°) 3 s before to 1 s during fixation for the same unit as represented in B. D, Mean ± SEM firing rate (in spikes per second) centered around fixation for the same unit as in B and C. E, The normalized mean firing rate for the neural ensemble during fixation (top) and randomly selected bouts (bottom). F, Projection in the first two modes after SVD showed little separation between fixation bouts (blue dots) and randomly selected bouts (gray dots). The ellipses correspond to the 50% confidence interval. G, Singular values across mode. The first 10 modes explain more of the variance than a shuffled and label-removed version of the data. H, Density distribution in the first mode for the fixation bouts (blue) and random samples (gray). Fixation (blue) and random (gray) values are transparent to show their overlap.

