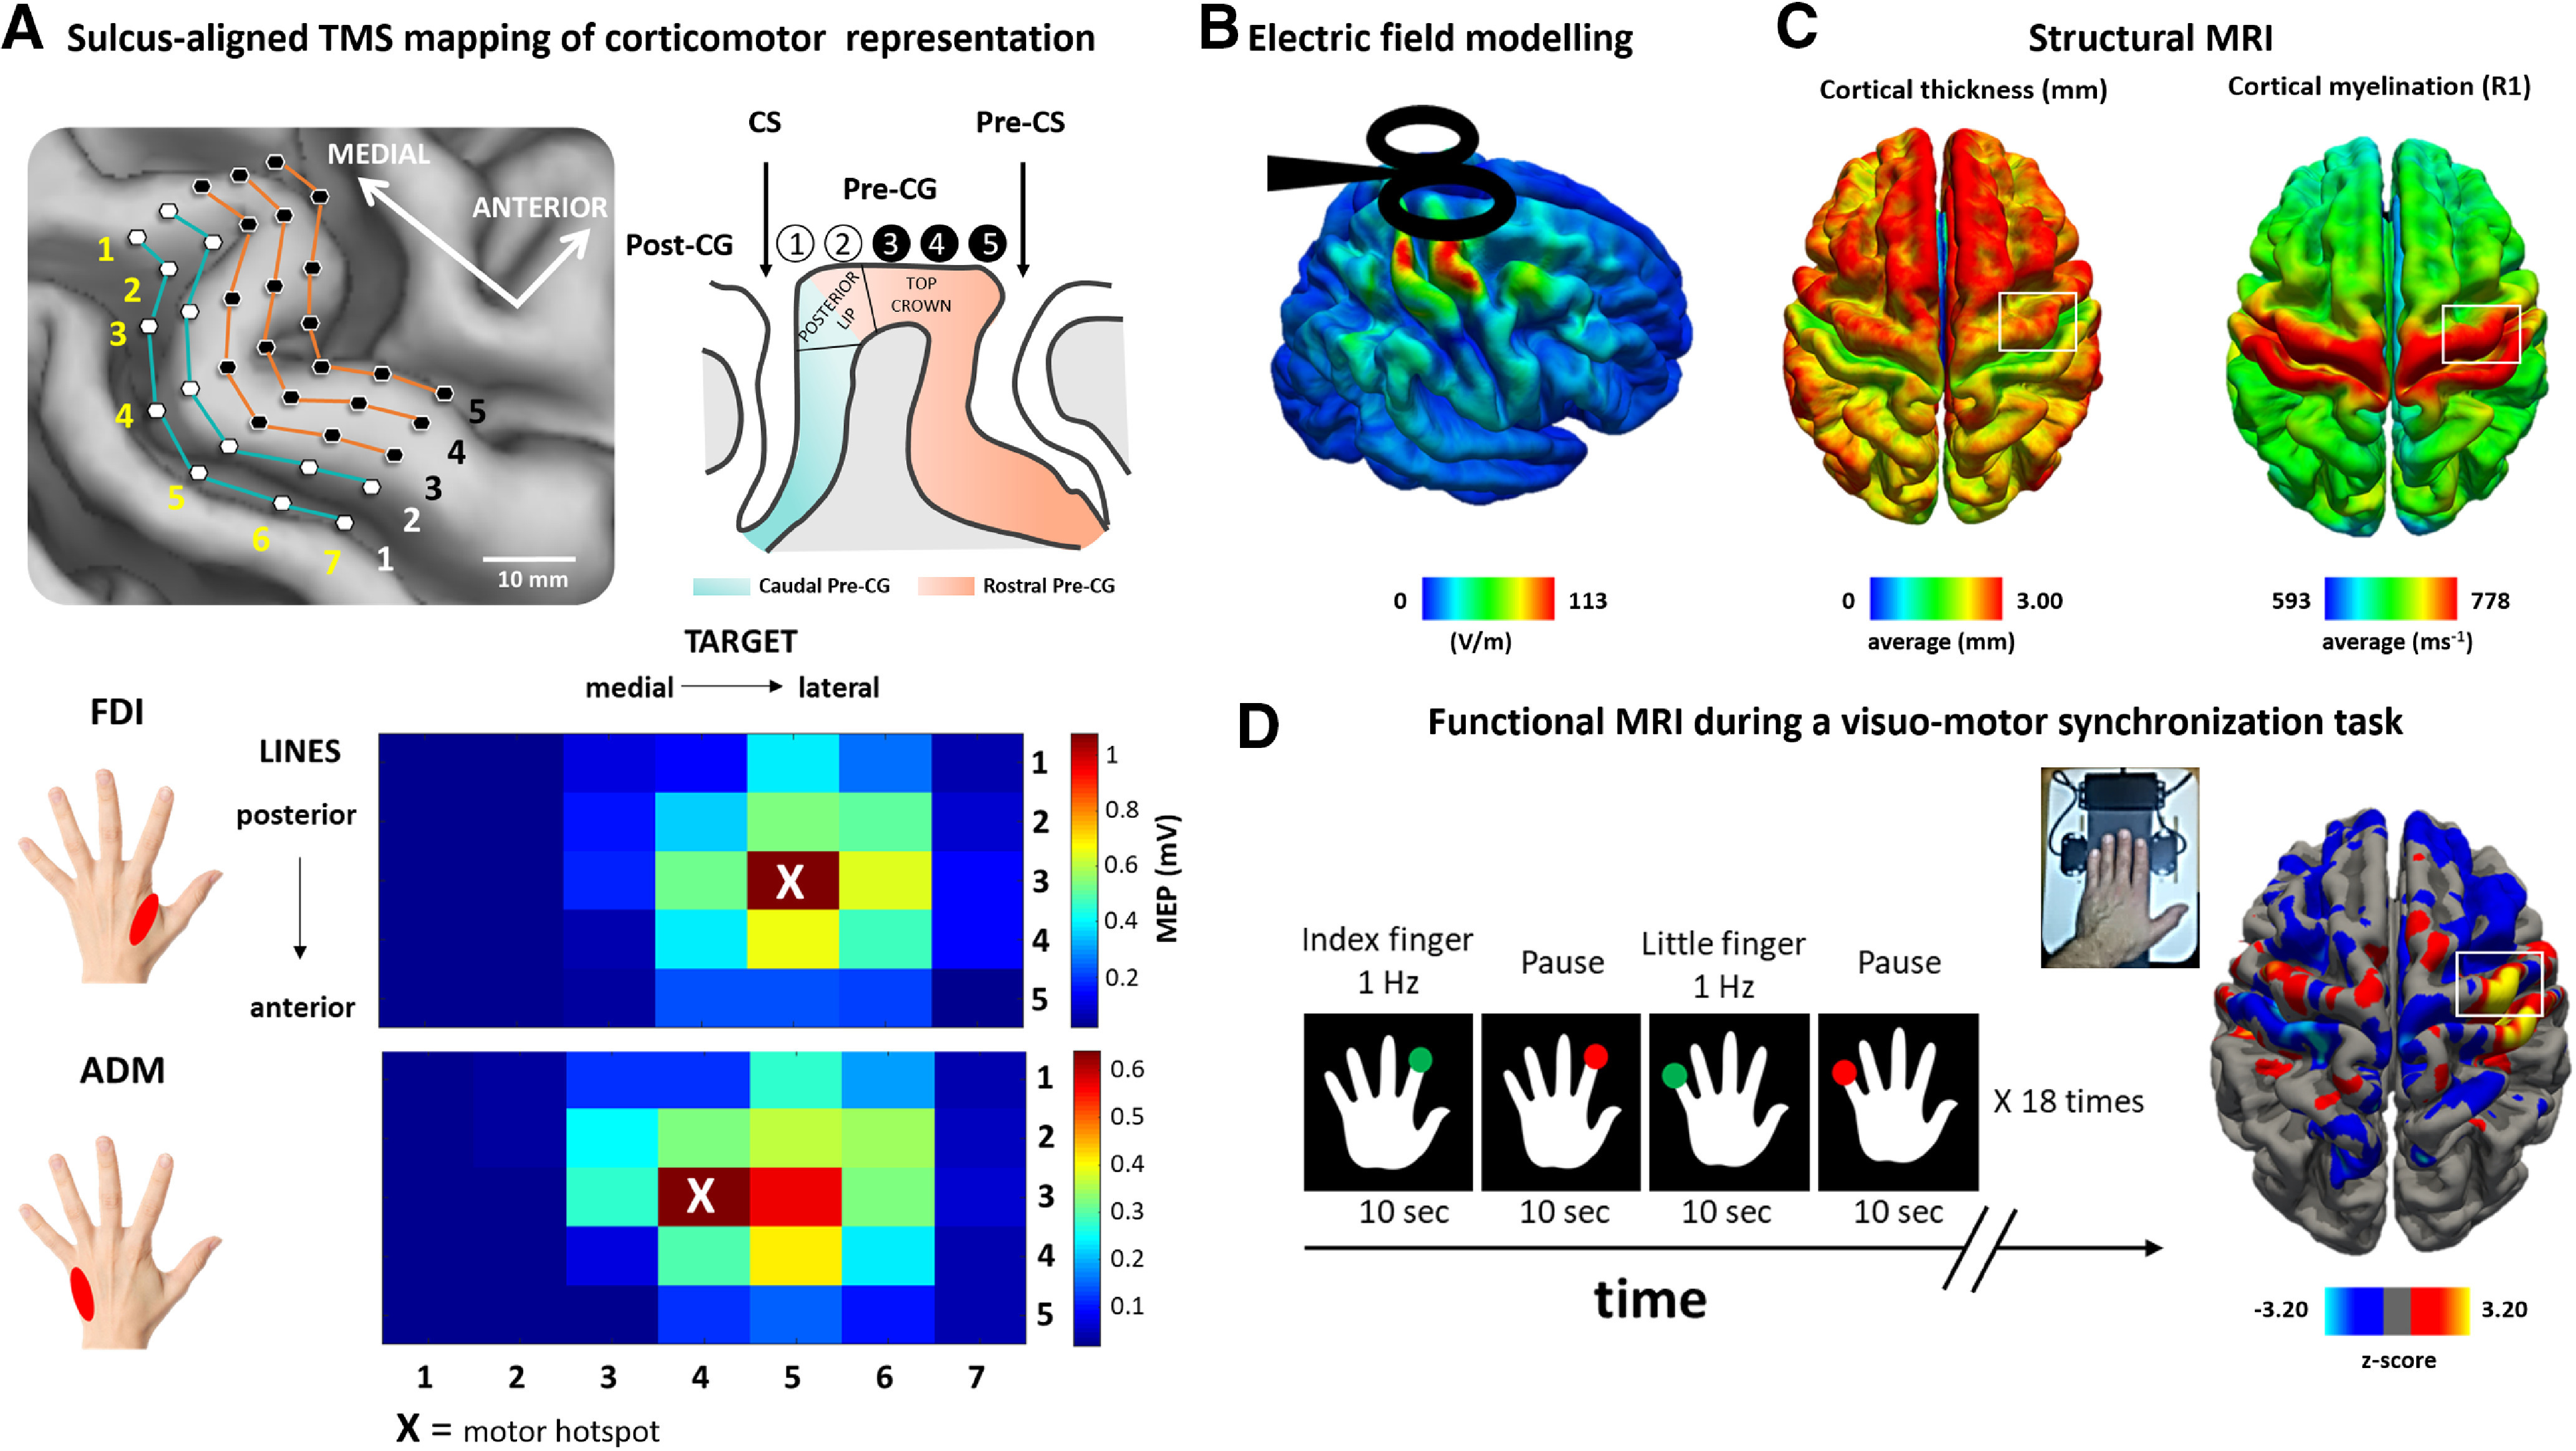
Figure 1.

Multimodal mapping of the precentral hand knob. A, Top, Sulcus-aligned mapping with single-pulse TMS. The mapping grid consists of five lines with seven target sites per line. The lines follow the individual shape of the precentral gyrus forming the right precentral hand knob. Single-pulse TMS was applied at each target site, and MEPs were recorded from left FDI and ADM muscles. The first two lines (light blue) corresponded to posterior lip of the (Pre-CG) crown. The remaining three lines (orange) corresponded to the top of the Pre-CG crown till the Pre-CS. Bottom, Color-coded corticomotor maps for the FDI and ADM muscles. Each square represents a stimulation site, and the color codes the mean MEP amplitude. Note that the FDI muscle is represented more laterally respect to the ADM muscle. B, Surface-rendered group map of the simulated electric field strength induced by TMS. C, Structural MRI: average distribution of cortical thickness (top) and cortical myelination (bottom) measured as longitudinal relaxation rate R1 = 1/T1 across all subjects. D, Average fMRI activity for voluntary abduction-adduction movements of the left index finger (FDI) and little finger (ADM) during a visually cued motor task at 1 Hz.
