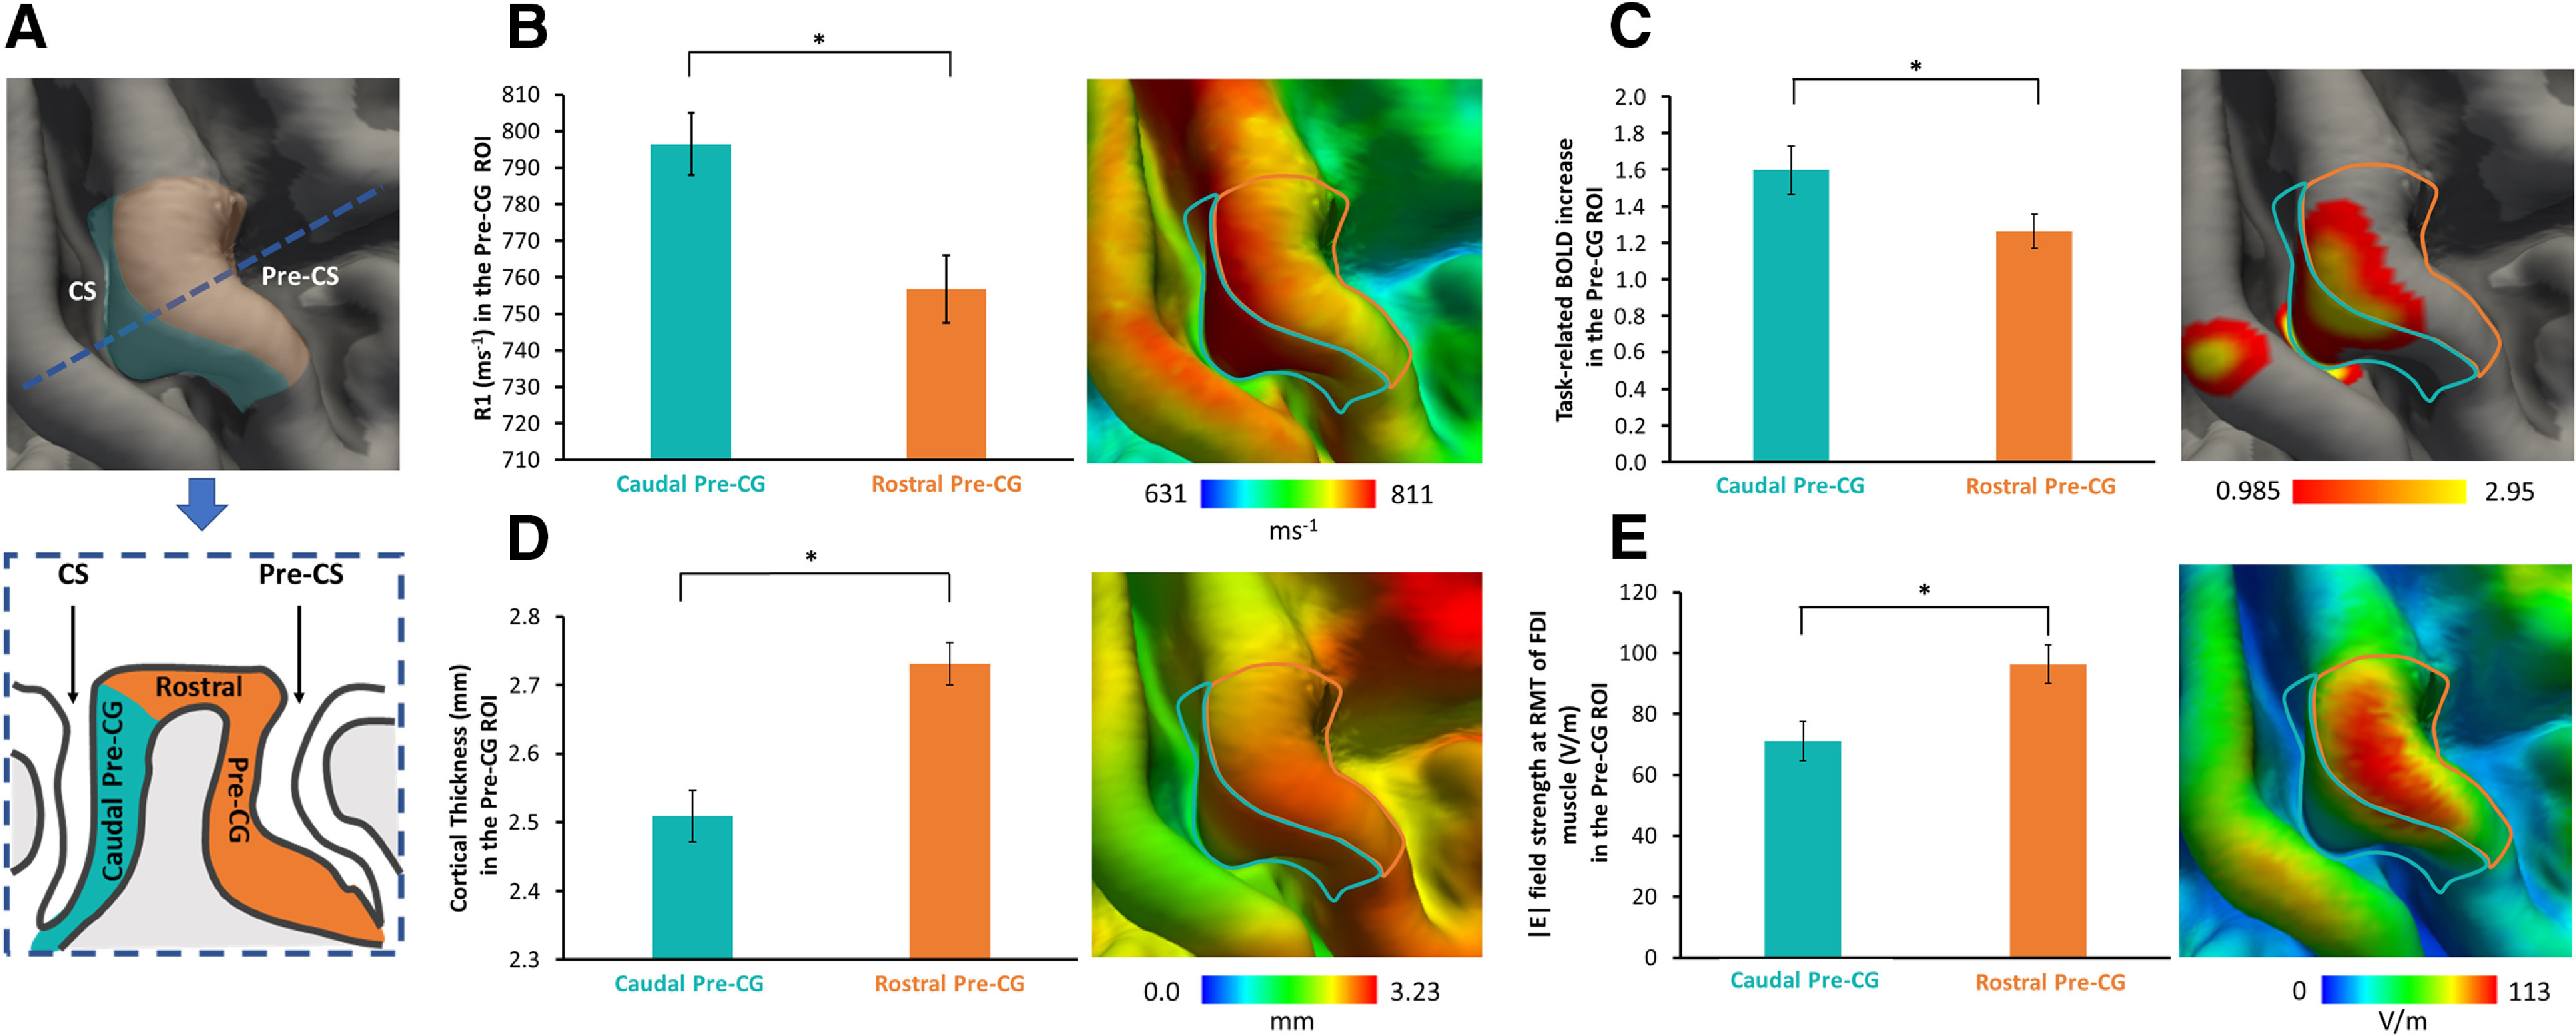
Figure 2.

Structural, functional, and electrical field properties of the right Pre-CG. A, Left, Right precentral ROI considered for the analyses, namely the light blue mask including the gyral wall facing the Central Sulcus (CS), caudal Pre-CG ROI, and the orange mask composed of the gyral crown and gyral wall facing the Pre-CS, rostral Pre-CG ROI. Bottom, Cross section (following the blue dotted line) of Pre-CG with a schematic representation of caudal Pre-CG and rostral Pre-CG ROIs. B–E, Significant differences are evident between the caudal Pre-CG and rostral Pre-CG ROIs regarding the cortical myelin content (B), functional activation during the visually cued movement repetition task (C), mean cortical thickness (D), and mean TMS-induced field strength (E). Each panel consists of a bar plot representing the regional mean (left) and a surface-rendered voxel-wise group map, including the borders of the two ROIs. *p < 0.01; paired t-test.
