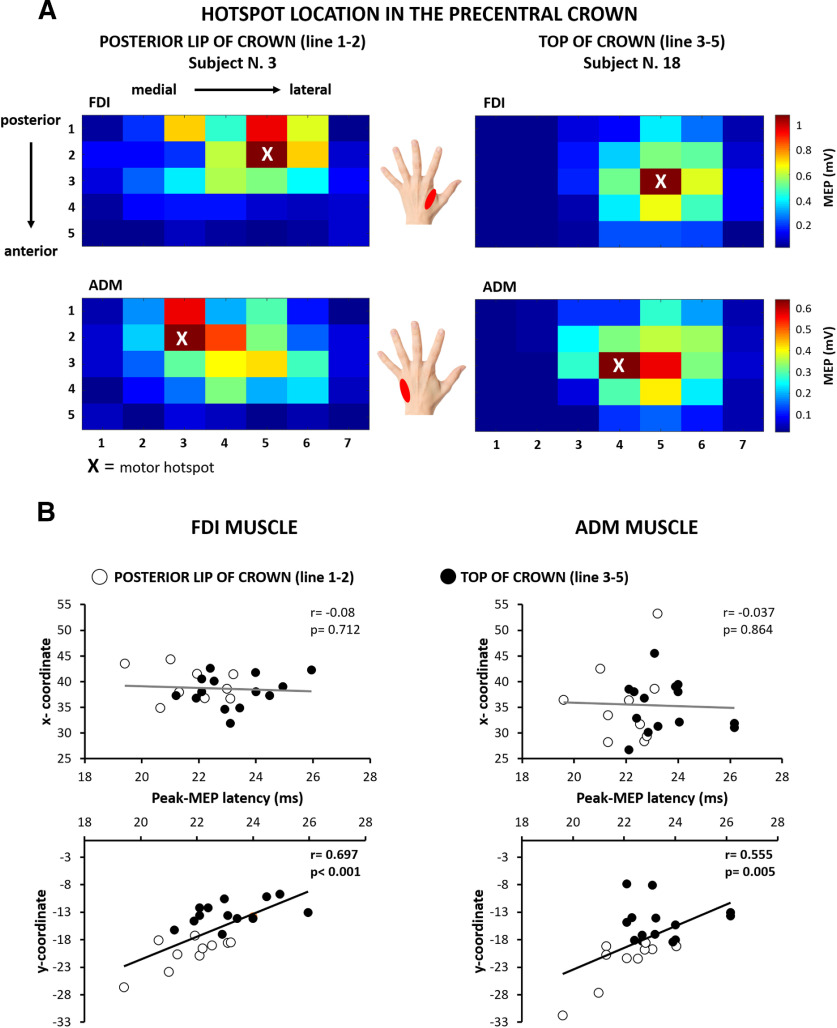
Figure 3.
Corticomotor maps of the right precentral hand knob derived from sulcus shape-based TMS mapping. A, Two-dimensional color-coded map illustrating the spatially distribution of corticomotor excitability in the right precentral hand knob. The motor hotspot is indicated by an “X.” Left, Map of an individual (subject 3) with caudal hotspot location in the posterior lip of the precentral gyrus for the FDI muscle (top) and ADM muscle (bottom). Right, Map of an individual (subject 18) with a more rostral hot spot at the top of the precentral crown. Each square corresponds to a specific target site determined by its mediolateral (targets 1–7) and posterior–anterior (lines 1–5) positions. B, Scatter plots plotting the x-coordinate (mediolateral direction) or y-coordinate (posterior–anterior direction) coordinates of the motor hot spot in MNI space against the shortest MEP latency recorded at the motor hot spot location. Significant correlations with MEP latencies were only found for the posterior–anterior position of the hotspot coordinates (y-coordinates) but not for the mediolateral position (x-coordinates). Open black circles indicate participants with a more caudal hot spot location in the posterior lip of Pre-CG (located on lines 1 and 2 of the mapping grid). Close black circles indicate participants with a more rostral hot spot location at the top of the Pre-CG crown (located on line 3 or 4 of the mapping grid). Please, note that the labeling of the x-axes is identical for all four scatter plots.

