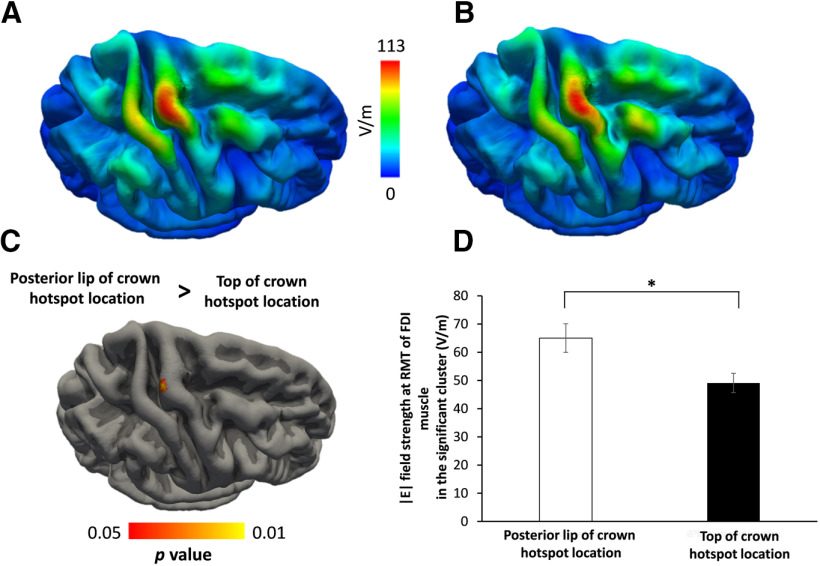
Figure 7.
Simulations of the electric field strength induced by TMS at motor hotspot locations. A, B, Color-coded surface-rendered group maps for participants with preferential hotspot locations in the posterior lip of the precentral gyrus (A) or at the top of the precentral crown (B). C, The surface-based statistical map shows a single cluster in the posterior lip of the precentral gyrus where participants with preferential hotspot location in the posterior lip of the pre-central gyrus crown display a higher electrical field strength than participants with a more rostral location of motor hotspot. D, Between-groups difference of the mean electric field strength extracted from the significant cluster in the posterior lip region. Mean electrical field strength in this cluster is higher in subjects with a more posterior motor hotspot location in the precentral crown (white column) than in subjects with a more rostral motor hotspot location (black bar; *t(16.7) = 2.604, p = 0.019; unpaired t test).

