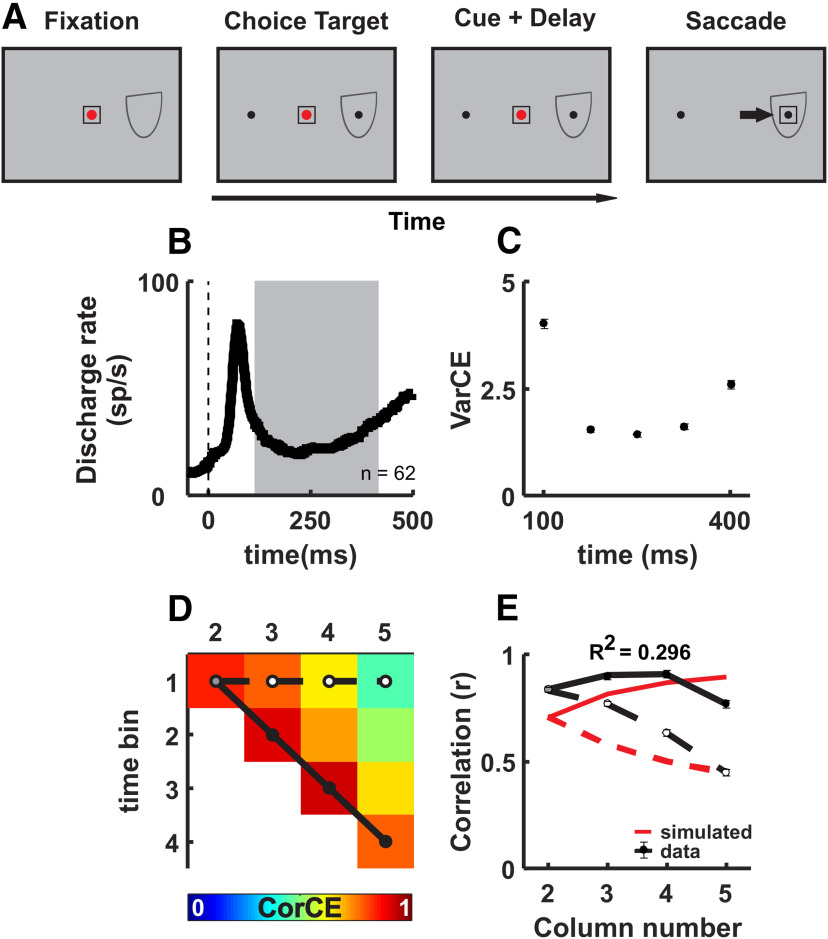
Figure 13.
Spiking statistics during simple saccades are not explained by decision processes. A, Schematic of the spatial arrangement of the delayed saccade task in which no evidence accumulation is required. The arrangement is the same as in Figure 1. B, Solid black lines indicate the averaged SDF (α = 20 ms) for SC neuronal activity plotted over time and aligned on the onset of the target (dashed vertical line). n = 62 recorded neurons over 19 sessions from the same 2 monkeys that performed the RDM task. Gray shaded region represents the epoch used for the VarCE and CorCE analyses. Error bars indicate the SD obtained from bootstrapping. C, The VarCE is plotted over time from 100 to 400 ms after target onset using the same data as in B. D, The matrix of CorCE through time displayed as a heat map. Warmer colors represent higher CorCE. The CorCE analysis used the same 60 ms time bins and the same data as in B. E, Comparisons between the CorCE values from the SC data (circles) and the theoretical CorCE (lines) from an accumulation process used to estimate ϕ in D. Top row of the CorCE matrix (filled dots) and the first juxtadiagonal (open dots) are presented. Error bars indicate the SD obtained from bootstrapping and are obscured by the symbols.

