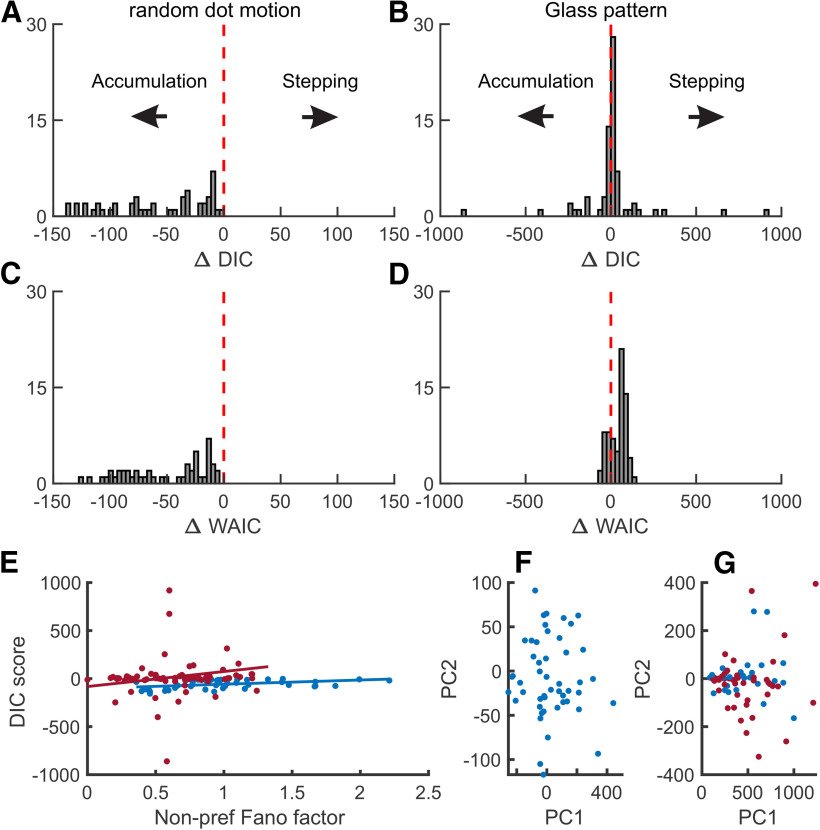
Figure 3.
DIC and WAIC analyses distinguish accumulation and stepping. Frequency histogram of ΔDIC and ΔWAIC values obtained for SC neurons in the RDM discrimination task and the Glass pattern detection task. Red vertical dashed line indicates no change in DIC or WAIC. Values to the right of 0 indicate larger support for stepping, and values to the left of 0 indicate larger support for accumulation. Each count shows the result from a single neuron. Note the x axis scale difference between A and B, as some neurons had extreme DIC values in the Glass pattern task. A, RDM task data. B, Glass pattern task data. C, D, Same as in A, B for the ΔWAIC. E, The nonpreferred (Tout) Fano factor plotted as a function of the ΔDIC score for both RDM (blue) and Glass pattern (red) tasks. The nonpreferred Fano factor was calculated from the same 300 ms epoch used for the DIC and VarCE/CorCE analyses. F, The first PC loadings plotted against the second PC loadings for each RDM neuron and (G) Glass pattern neurons. Blue points indicate a negative ΔDIC (accumulating). Red points indicate a positive ΔDIC (stepping). Units on the PC1 and PC2 axes are arbitrary.

