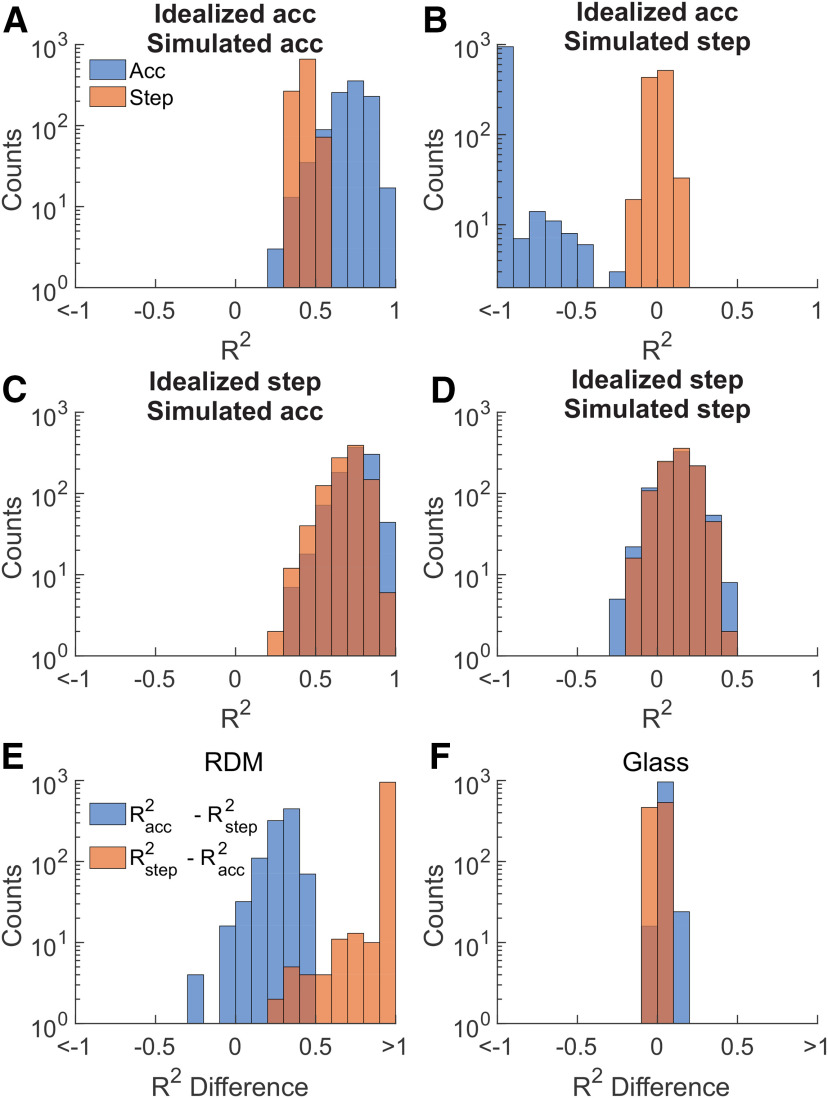
Figure 9.
CorCE classification as applied to simulated rates from accumulation and stepping models using SC parameters determined from empirical data. A, Pairs of R2 distributions obtained by applying the R2 goodness of fit of CorCE analysis on simulated accumulating spikes. Here, the artificial spikes are simulated using parameters estimated from the RDM dataset. The R2 distribution reflects the analysis repeated over 1000 different simulated datasets. The blue distribution was obtained by comparing the simulated data to an idealized accumulation CorCE. The orange distribution is the same using an idealized stepping CorCE. B, Same as in A, but using simulated stepping spikes using parameters from the RDM dataset. C, Same as in A, but using simulated accumulating spikes using parameters from the Glass pattern dataset. D, Same as in A, but using simulated stepping spikes using parameters from the Glass pattern dataset. E, Pairwise differences of R2 vales from the RDM parameterized spikes used in the R2 goodness of fit of CorCE analysis to identify the better fitting model. Blue histogram represents the pairwise R2 differences between the R2 values in A. Orange histogram represents the pairwise R2 differences between the R2 values in B. Difference values >0 indicate that the simulated spikes we correctly categorized as stepping or accumulating. F, Same as in D, but for the Glass pattern parameterized spikes.

