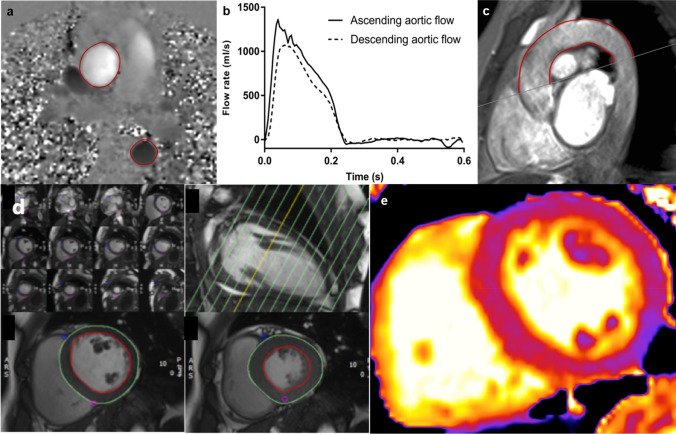
Fig. 1.
Assessment of pulse wave velocity using two-dimensional phase-contrast CMR. For the PWV calculation, axial aortic contours were mapped onto phase–contrast cines (a), allowing the waveform transit time to be calculated from flow curves of the ascending and descending aorta (b). Distance was measured using a sagittal–oblique cine. Outer and inner borders of the aortic arch were manually drawn and the mean distance of these two borders was calculated (mm) (c). LV mass and volumes measured from a contiguous short-axis stack of cine images planned from long-axis view with endo and epicardial contours drawn at end-diastole and end-systole (d). Native T1 mapping of a short-axis ventricular slice of the left ventricle for assessment of myocardial fibrosis (e)

