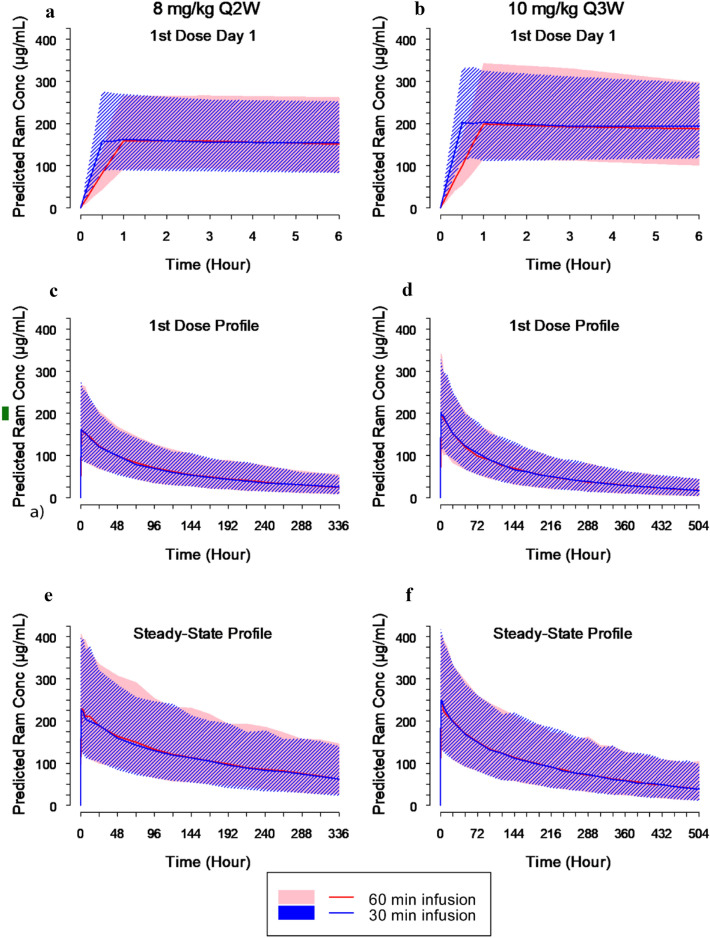
Fig. 1.
Predicted ramucirumab concentration (µg/ml) time profiles following administration of 8 mg/kg every 2 weeks (a, c, e) or 10 mg/kg every 3 weeks (b, d, f) based on a time-varying clearance population pharmacokinetic model (established using ramucirumab pharmacokinetic data from 17 studies (2522 patients). Data following the first dose (a–d) and at steady state (e, f) are shown. CL clearance, conc concentration, Q2W every 2 weeks, Q3W every 3 weeks, Ram ramucirumab. Shaded regions represent the 5th and 95th percentile ramucirumab concentrations calculated from 500 simulation iterations

