Fig. 3.

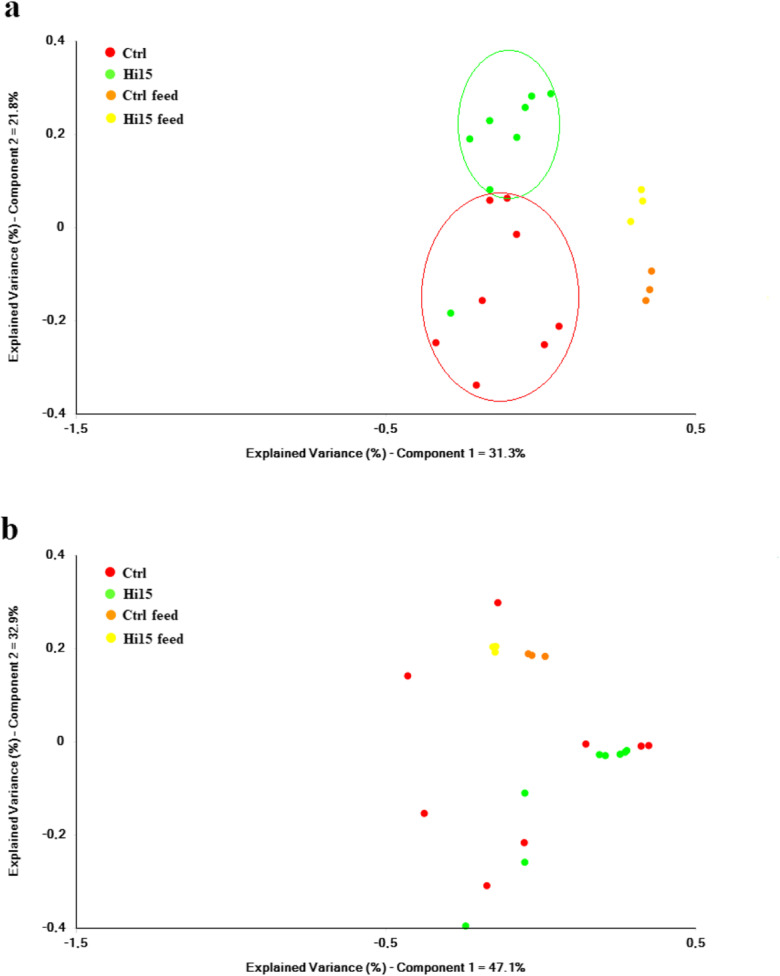
PCoA plot of unweighted (a) and weighted (b) UniFrac distances of gut microbial communities associated to two experimental dietary groups. Each dot represents an individual sample according to its microbial profile at genus level

PCoA plot of unweighted (a) and weighted (b) UniFrac distances of gut microbial communities associated to two experimental dietary groups. Each dot represents an individual sample according to its microbial profile at genus level