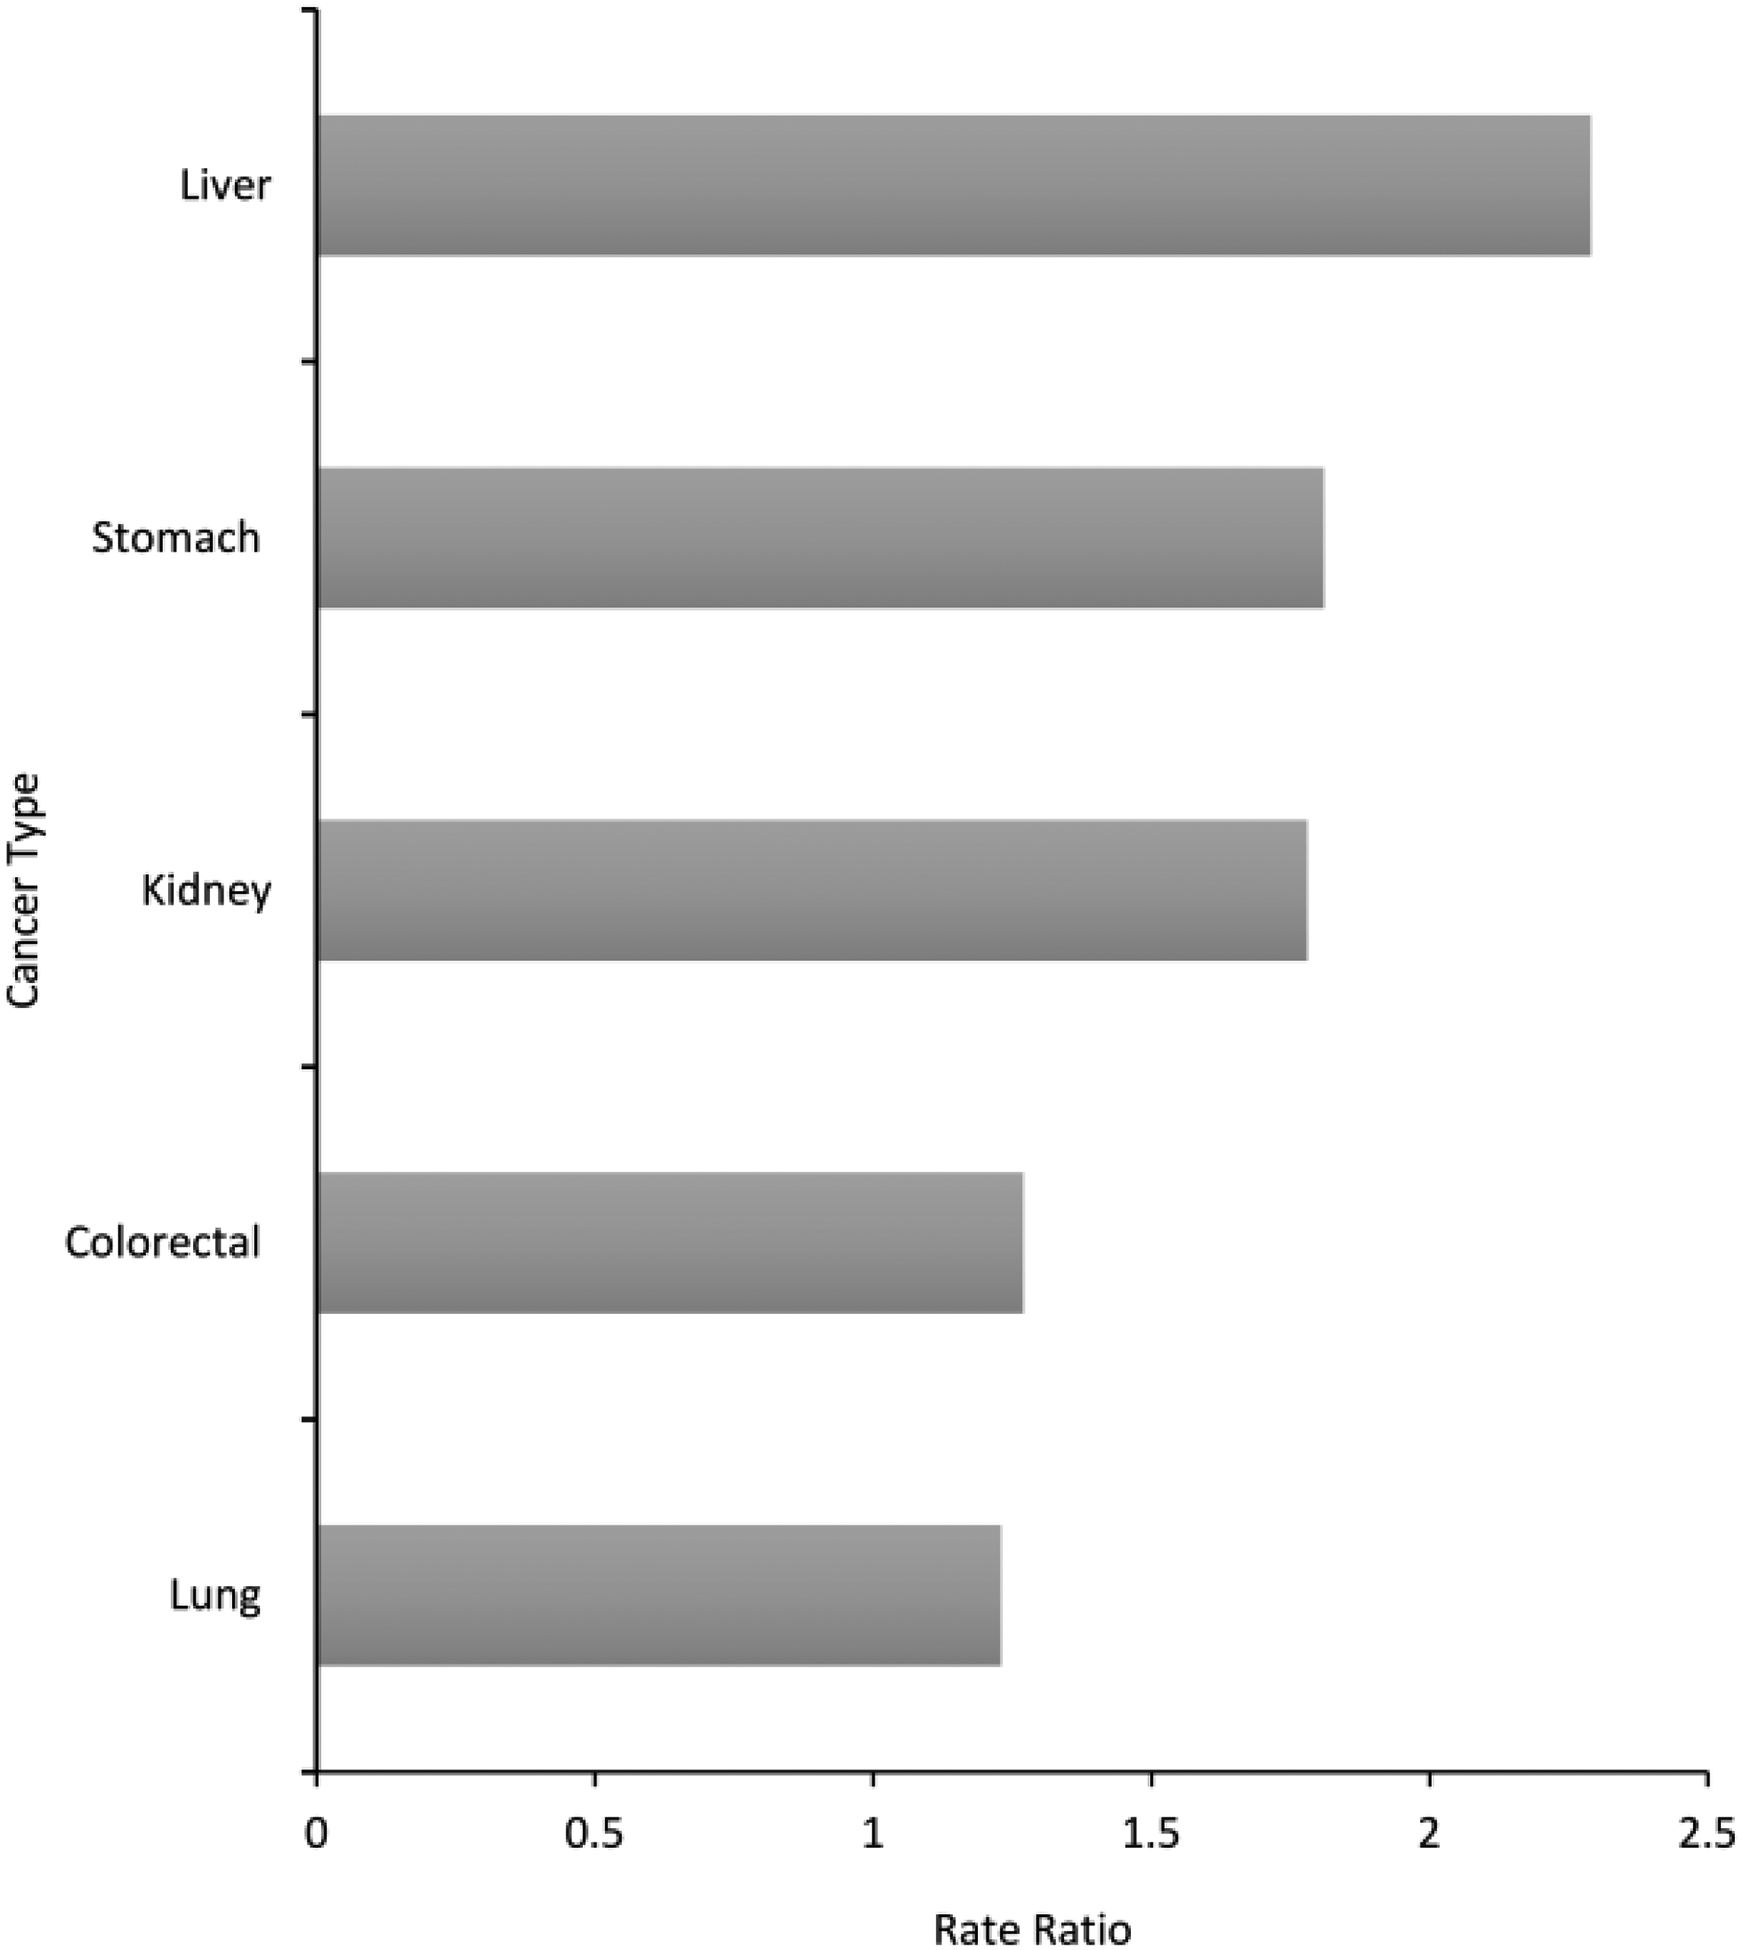
Figure 2:

Male versus female rate ratio for leading cancers with elevated incidence among AI/AN populations, PRCDA, 2012–2016. Leading cancers with elevated incidence selected from 15 leading cancers. See Web Tables 1 and 2. Source: Cancer registries in the Centers for Disease Control and Prevention’s National Program of Cancer Registries (NPCR) and/or the National Cancer Institute’s Surveillance, Epidemiology and End Results Program (SEER). Rate ratios (RR) are AI/AN versus White and are calculated in SEER*Stat prior to rounding of rates and may not equal the RR calculated from the rates presented in the table. Only leading causes of excess cancer burden that were common between males and females, and significantly greater than the White population are shown in this graph.
