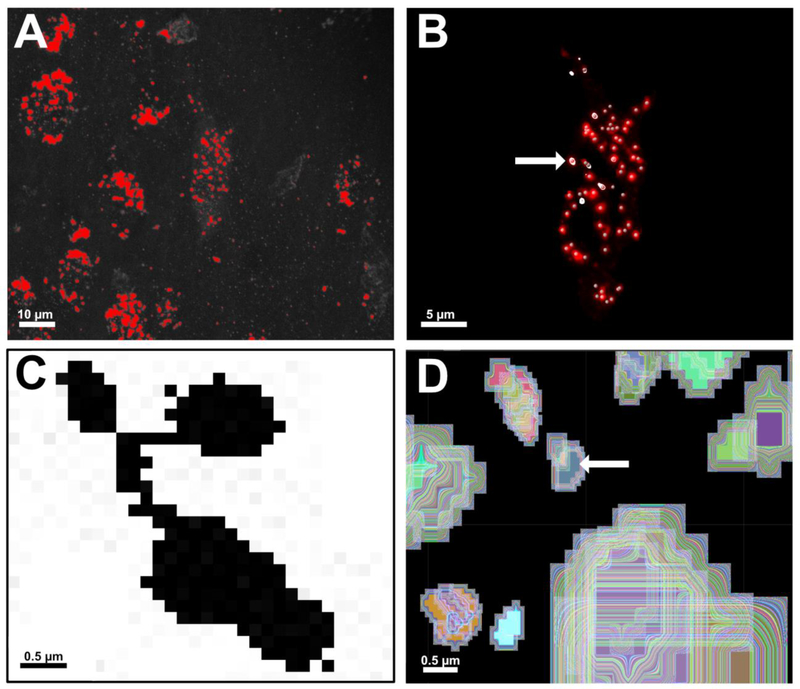
Figure 5.
A comparison of global thresholding versus local thresholding of early endosomes (A-B) and edge detection versus seeded region growing (C-D) in ImageJ and Imaris, respectively. A. Global thresholding being performed on a 3D reconstruction in ImageJ to convert the image from greyscale to binary black and white. Early endosomes are colored red, signifying they will be classified as foreground pixels in the subsequent binary image. Global thresholding measures pixel intensity across the entire image, making it vulnerable to inconsistencies in image resolution, staining intensity, and signal-to-noise ratios. Scale bar: 10 μm. B. Local thresholding being performed in Imaris using “Spots”. Local thresholding measures voxel intensities within a locally defined neighborhood. Creation of the mask channel forces “Spots” to measure red voxels only within the ROI, leading to more accurate detection of Rab5-immunolabeled early endosomes (central point denoted by grey spheres). Early endosomes highlighted in white (arrow) are all located on the same XY plane of focus within the 3D reconstruction. Use of the XY Orthoslicing tool enables precise assessment of a chosen threshold value for each endosome detected within the BFCN. Scale bar: 5 μm. C. A zoomed-in image of a cluster of ~4–5 early endosomes in ImageJ after thresholding. The “Analyze Particle” command in ImageJ uses 8-neighbor pixel connectivity during edge detection. All black pixels in the image would be counted as a single endosome unless manually separated with white pixels using the “Paintbrush” tool. D. Imaris employs seeded region growing to count and measure individual Rab5-positive early endosomes. A seed point is placed on the voxels of highest intensity at the center of an identified object (arrow). The region is then grown outward in 3 dimensions until borders detected during prior background subtraction steps are reached. In this representative image, each trace around the seed point has been color coded to illustrate this principle. Scale bar C-D: 0.5 μm.

