
Figure 1: Differential response of CDK4/6 inhibition in different models:
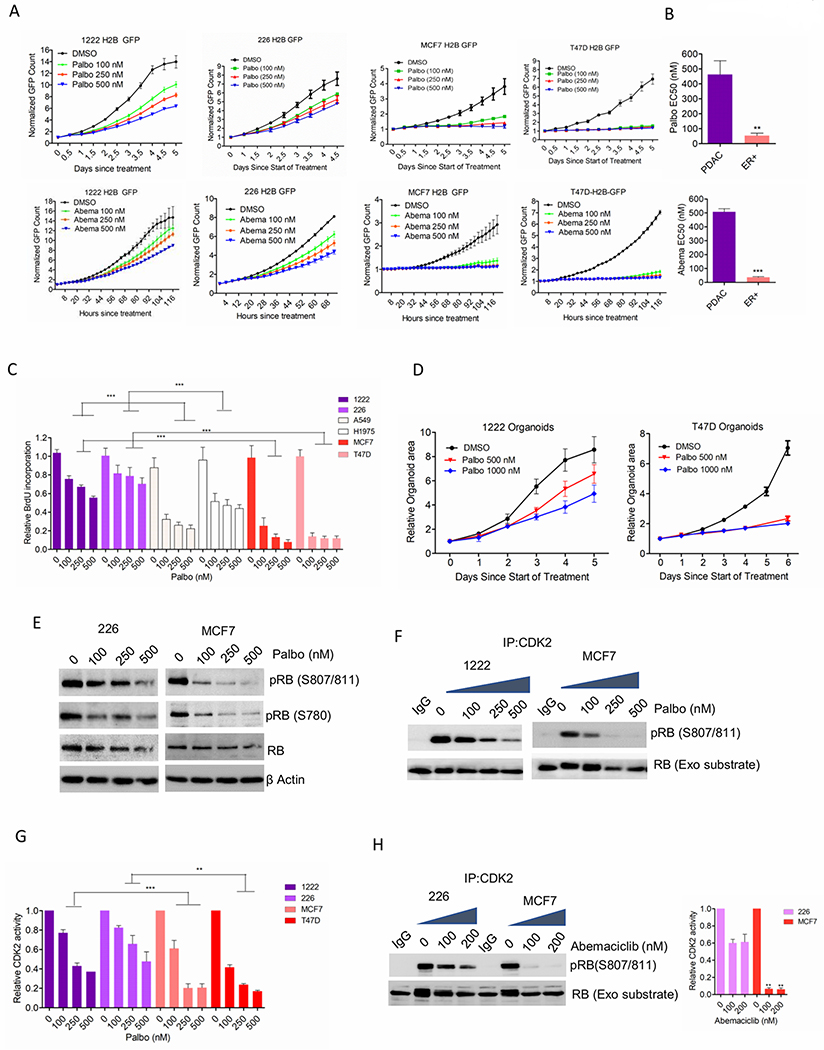
(A) Growth rates of 1222, 226, MCF7 and T47D cells, treated with palbociclib and abemaciclib. Bars indicate mean and SD. (B) Column graph represents the EC50 values of palbociclib and abemaciclib. Mean and SEM are shown (t-test). (C) BrdU incorporation on the indicated cell lines following 72 H exposure with palbociclib. Bars represent mean and SD (1-way ANOVA). (D) Growth of organoids derived from 1222 and T47D cells treated with palbociclib. Bars represent mean and SD. (E) Western blot analysis on MCF7 and 226 cells following 48 H exposure with palbociclib. (F) In vitro CDK2 kinase assays on MCF7 and 1222 cells treated with palbociclib up to 48 H. Kinase activity was evaluated based on the phosphorylation of an exogenous RB fragment as substrate at S807/811. (G) Densitometry analysis on RB phosphorylation. Column represents the mean and SEM (1-way ANOVA). (H) MCF7 and 226 cells treated were treated with up to 48 H and the CDK2 kinase activity was evaluated. Representative blot images and mean and SEM are shown (1-way ANOVA). Graphs represent 2 independent experiments with 3 replicates. (***p<0.001).