
Figure 1: Generation and characterization of Plk1 transgenic mice.
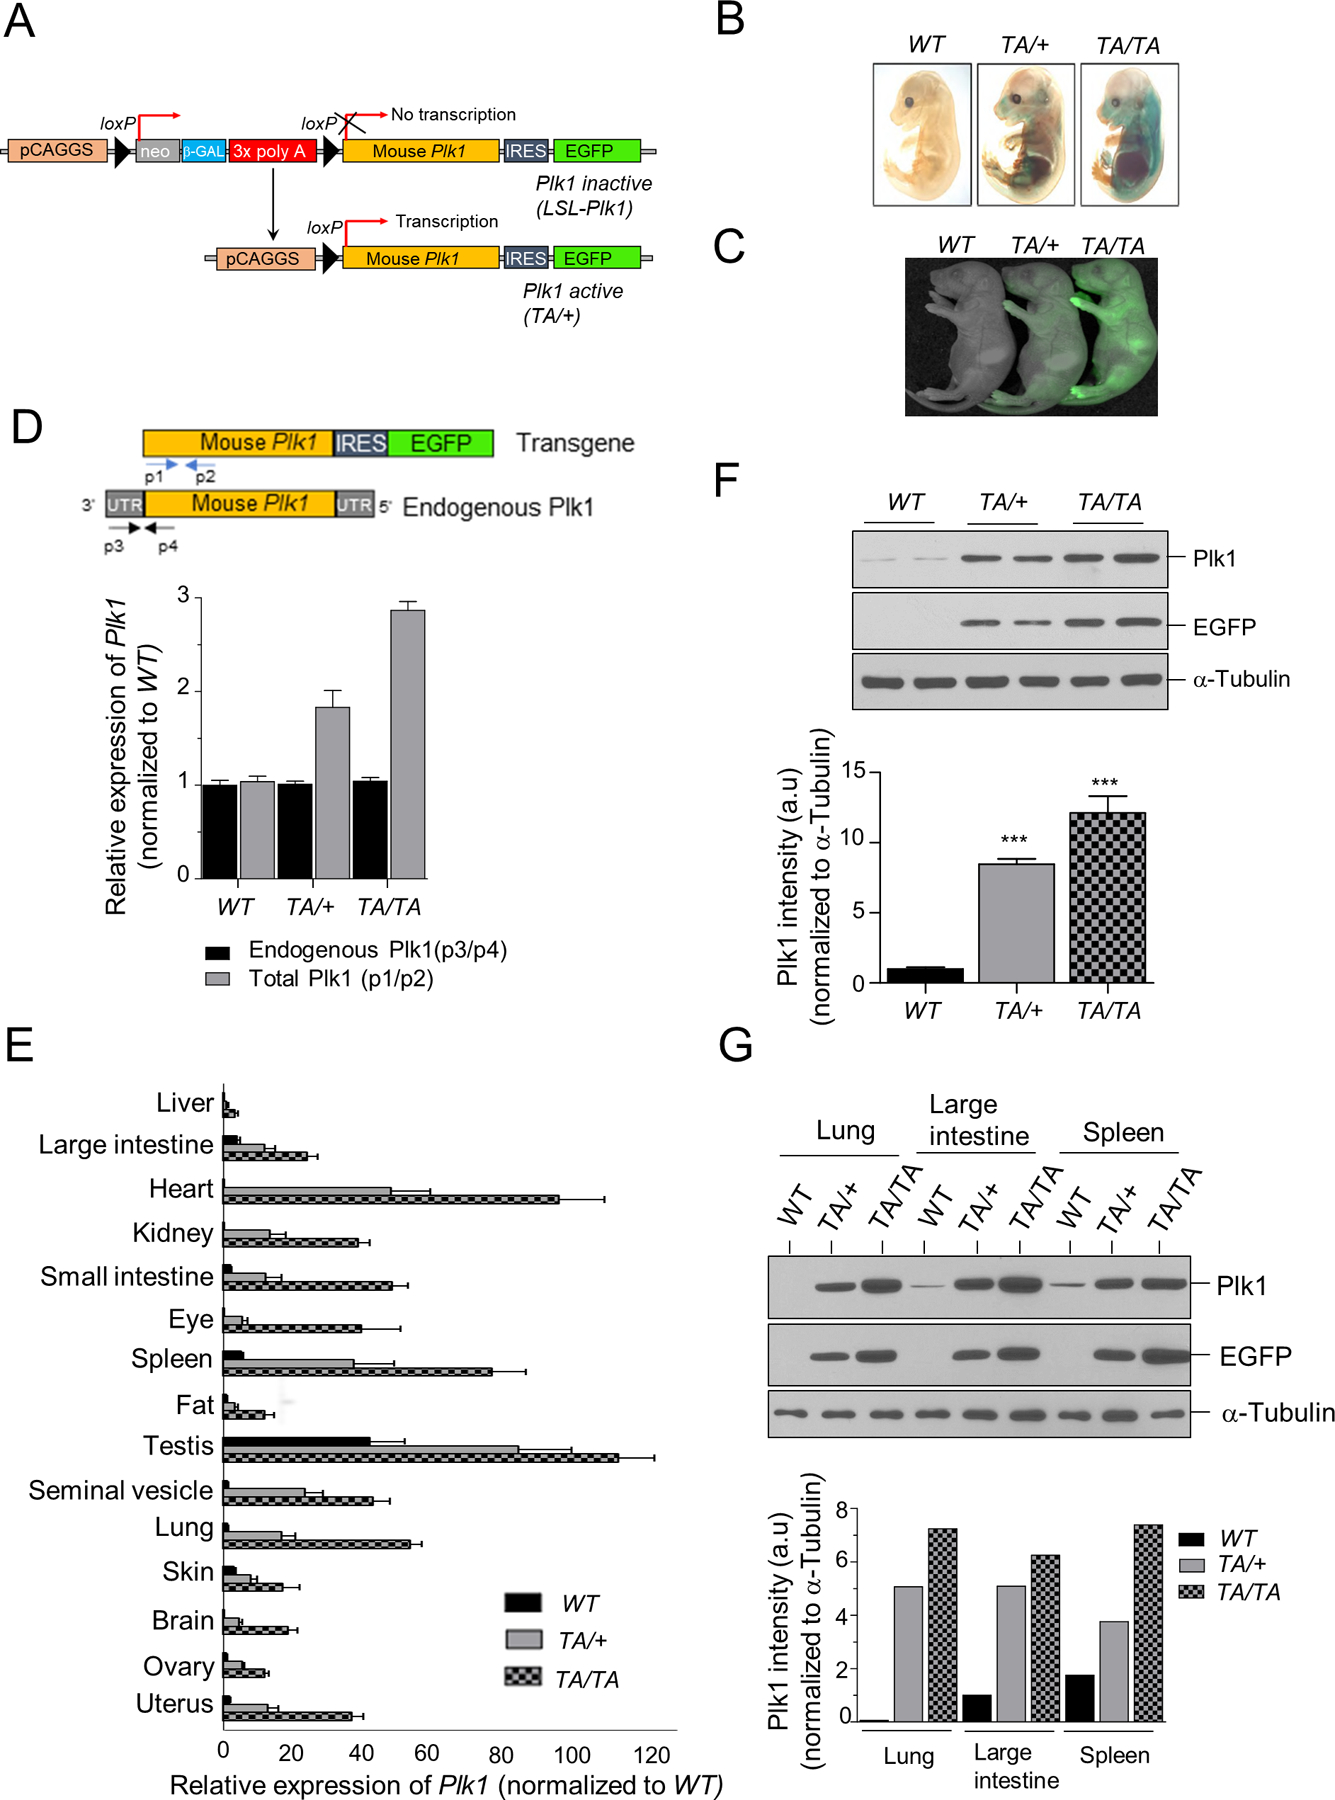
(A) Schematic of Plk1 transgenic mice generation. (B) β-galactosidase staining of WT: wild-type; TA/+: Plk1TA/+; TA/TA: Plk1TA/TA E13.5 mouse embryos. (C) EGFP fluorescence from 1d-old pups of the indicated genotypes. (D-E) qRT-PCR for Plk1 transcripts in PMEFs (D); tissues from transgenic mice (E) of indicated genotypes. Blue and black arrows show primer positions for analysis of the total p1/p2) and endogenous (p3/p4) Plk1 transcript, respectively. (F-G) Western blot (WB) analysis of PMEF cell extracts (F); tissue extracts (G) from transgenic mice. Plk1 and EGFP WB with α-Tubulin loading control. Bottom panel: Plk1 protein quantification of this WB.