
Figure 3: Overexpression of Plk1 induces aneuploidy.
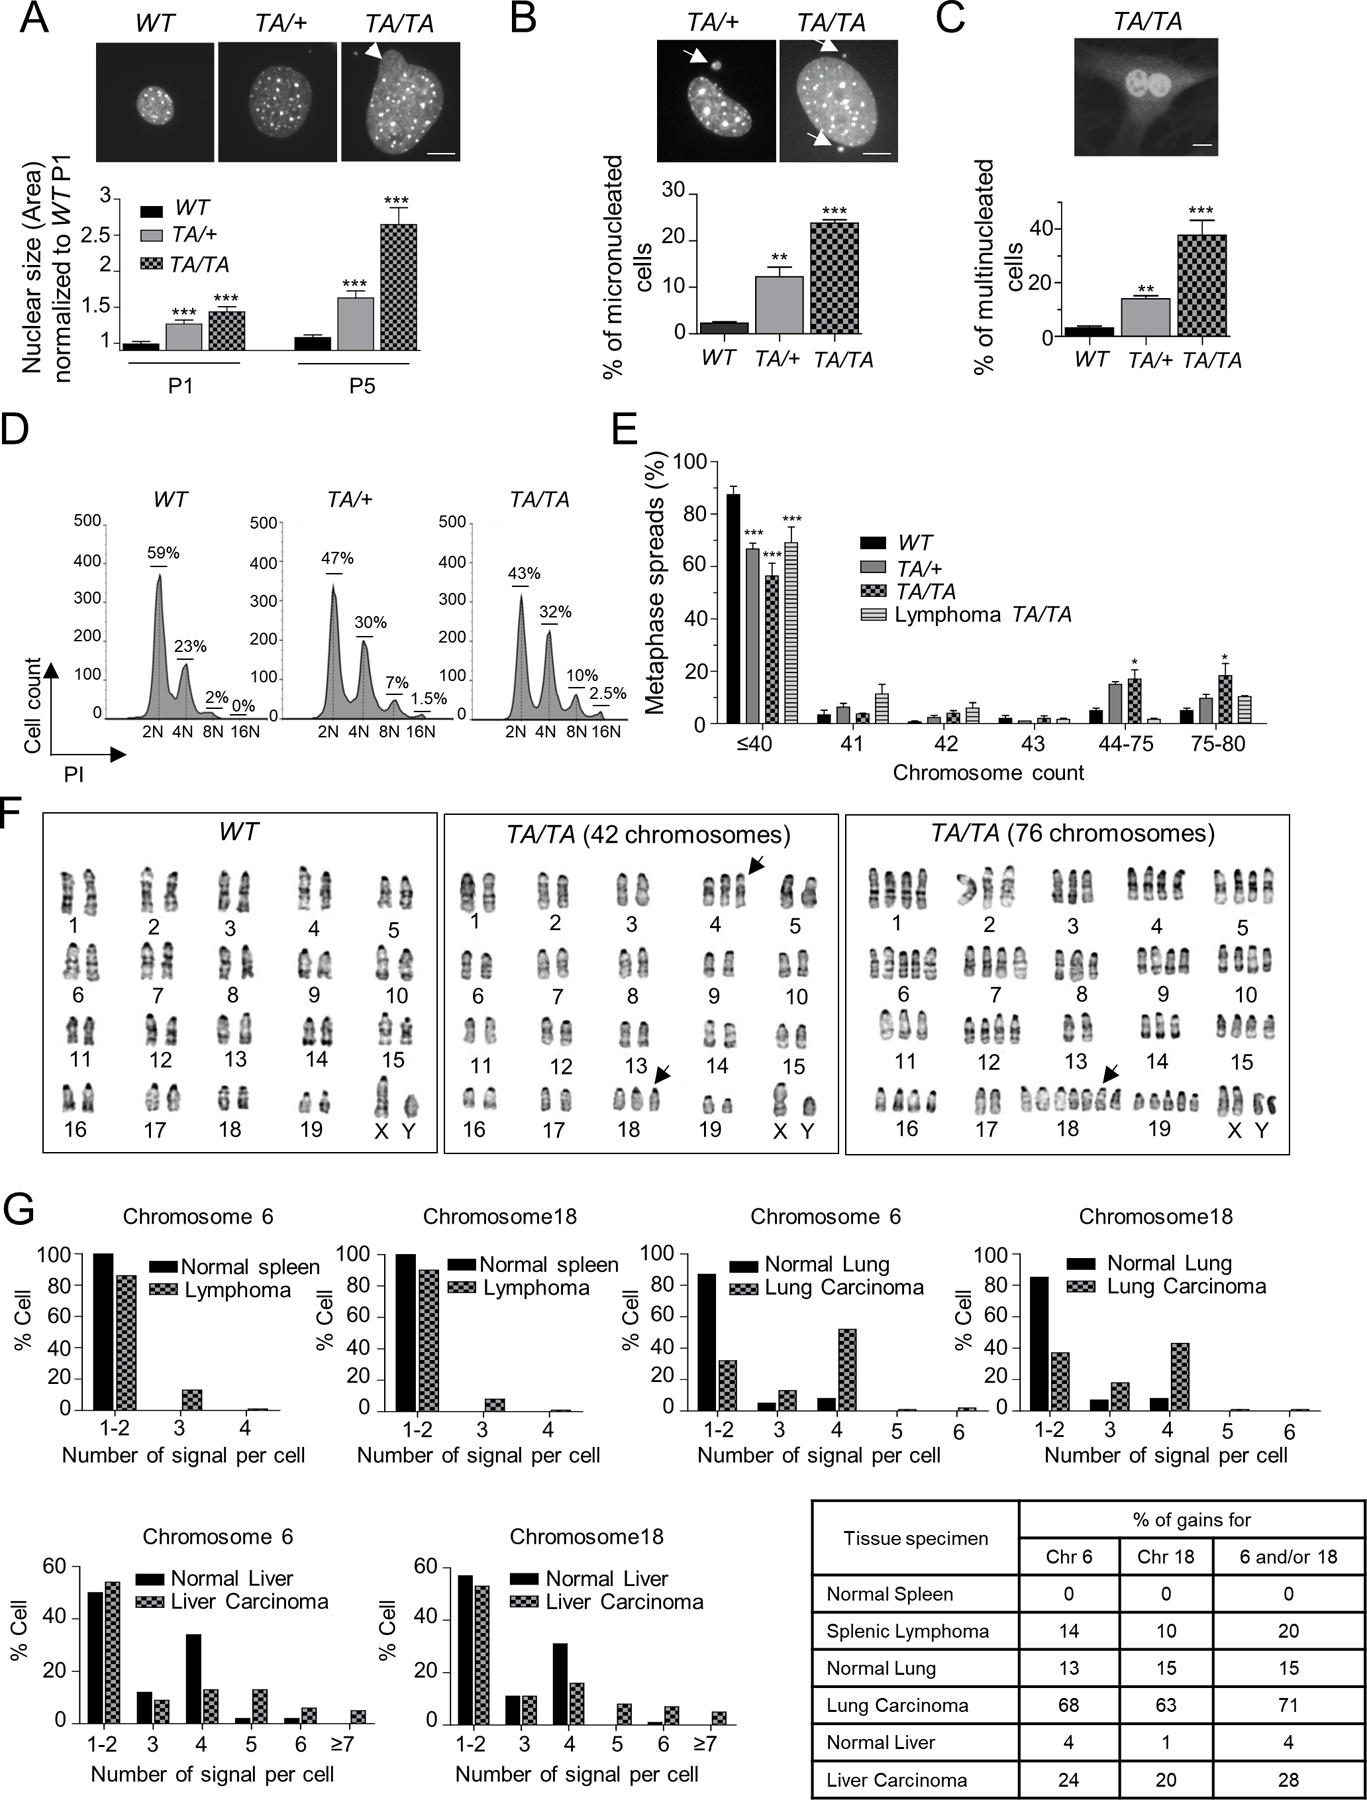
(A, B) (Top) Representative WT, TA/+ and TA/TA PMEFs stained with DAPI. (Bottom) (A) Nuclear size of WT, TA/+ and TA/TA P1 and P5 PMEFs, normalized to P1 WT PMEFs (B) Percentage of micronucleated WT, TA/+ and TA/TA PMEFs. Fifty cells/genotype, repeated 3x. (Mean ± SEM, **: p <0.01; ***: p< 0.001). Scale bar: 10 µm. Arrow head: nuclear buds; arrow: micronuclei. (C) (Top) Representative binucleated TA/TA PMEFs stained with DAPI and Plk1. (Bottom) Percentage of multinucleated cells per genotype. Fifty cells/genotype, repeated 3x. (Mean ± SEM, **: p < 0.01; *** p < 0.001). Scale bar: 10 μm. (D) DNA content in asynchronous WT, TA/+ and TA/TA PMEFs via flow cytometry. (E) Chromosome counts of WT, TA/+ and TA/TA PMEFs, and TA/TA lymphomas metaphase spreads. One hundred metaphases/genotype; repeated 3x. (Mean ± SEM, WT vs TA/+ or TA/TA, *: p < 0. 05; *** p < 0.001, t-test). (F) WT and TA/TA PMEFs karyograms. (Left) Representative GTG-banding of chromosomes from WT cells, showing a typical mouse complement of 40 chromosomes. (Middle) Representative metaphase spread from TA/TA PMEFs showing a cell with a total of 42 chromosomes (additional chromosome 4 and 18 [highlighted by arrows]). (Right) Representative TA/TA PMEF metaphase spread showing a cell with a near-tetraploid complement (76 chromosomes), including 7 copies of chromosome 18. (G) Interphase FISH analysis of 5-µm paraffin sections of a splenic lymphoma and lung and liver carcinomas from Plk1 transgenic mice and their respective WT tissues, hybridized to both peri-centromeric chromosome 6 and 18 probes. 100 cells/section. Percent gain in lung and spleen specimens represent gains of ≥1 signal in each cell; in liver, gains of >2 signals due to the physiological hepatocyte tetraploidy.