
Figure 5: Plk1 overexpression promotes proliferation of giant polyploidy and micronucleated cells.
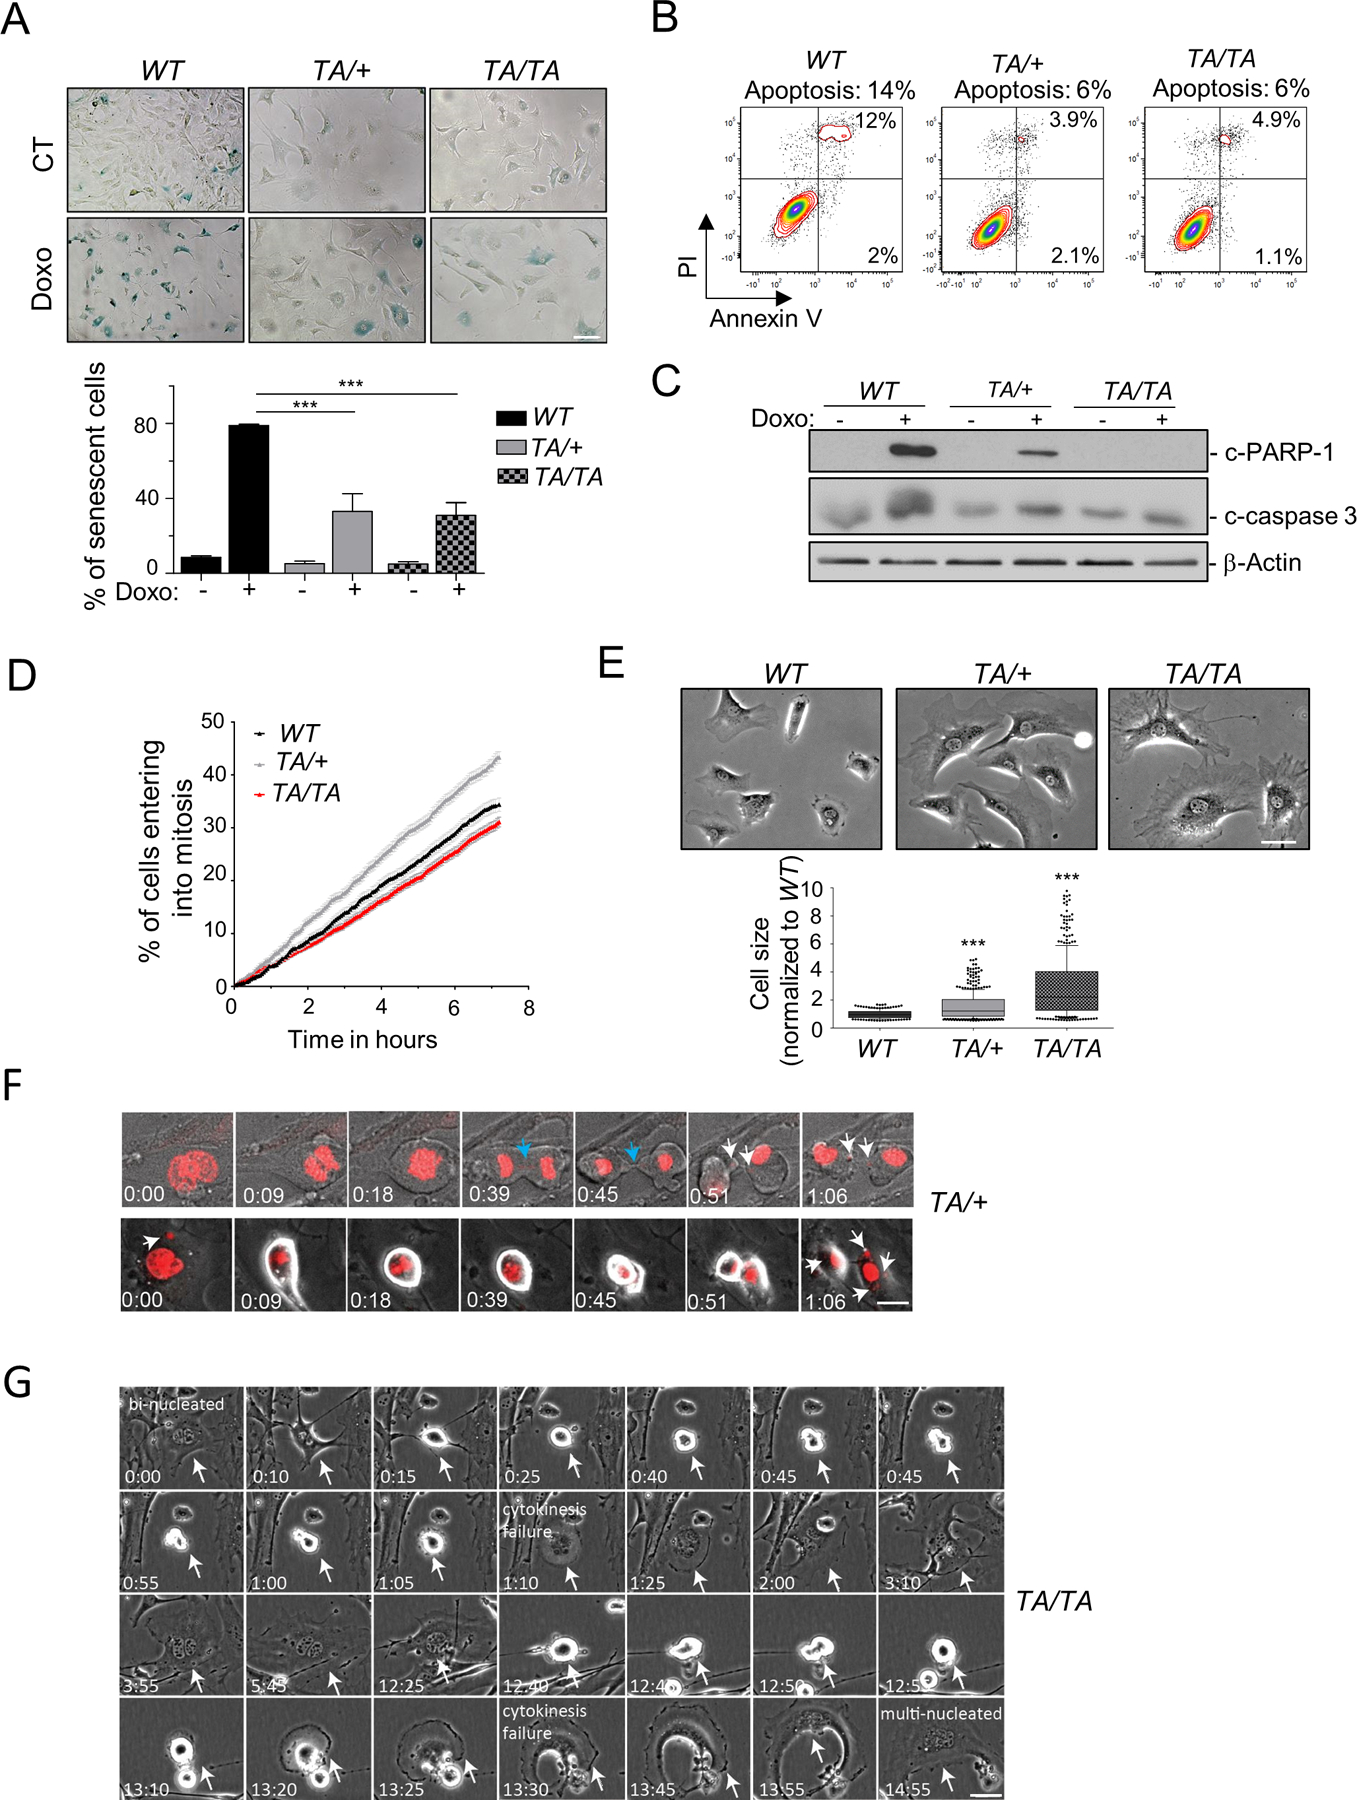
(A) (Top) Representative senescence-associated (SA) β-galactosidase activity in unperturbed PMEFs (P5) and 48 hrs post-treatment with doxorubicin (Doxo) (0.5μM, 8 hrs). Scale bar: 20 μm. (Bottom) Quantification of SA β-galactosidase positive cells. 200 cells/genotype, repeated 3x. (Mean ± SEM, ***: p < 0.001, t-test). (B) Unperturbed WT and Plk1 transgenic PMEFs (P5) were stained with Annexin V and PI and analyzed by flow cytometry. Numbers indicate percentage of apoptotic cells in the total population. (C) WB of untreated or Doxo (0.5μM, 8 hrs) treated WT and Plk1 transgenic PMEFs. Loading control: β-Actin. (D) Entry into mitosis (defined by nuclear envelope break down) of asynchronous PMEFs of indicated genotypes recorded by phase-contrast video-microscopy (5 min/image). Graph represents cumulative percentage of cells that have entered mitosis over time, normalized to cell density. 200 cells/genotype, repeated 3x. (Mean ± SEM). (E) (Top) Representative phase images of WT and Plk1 transgenic PMEFs. (Bottom) Cell size quantification, normalized to WT. 200 cells/genotype, repeated 3x (Mean ± SEM, ***: p < 0.001, t-test). Scale bar: 20 μm. (F) Representative images of binucleated and micronucleated TA/+ PMEFs expressing H2B-mCherry monitored during mitotic entry progression. Arrows – white: micronuclei; blue: chromatin bridge. Scale. Scale bar: 10 μm. (G) Representative binucleated TA/TA PMEFs monitored during 2 cell divisions. White arrow: binucleated cell. Scale bar: 10 μm.