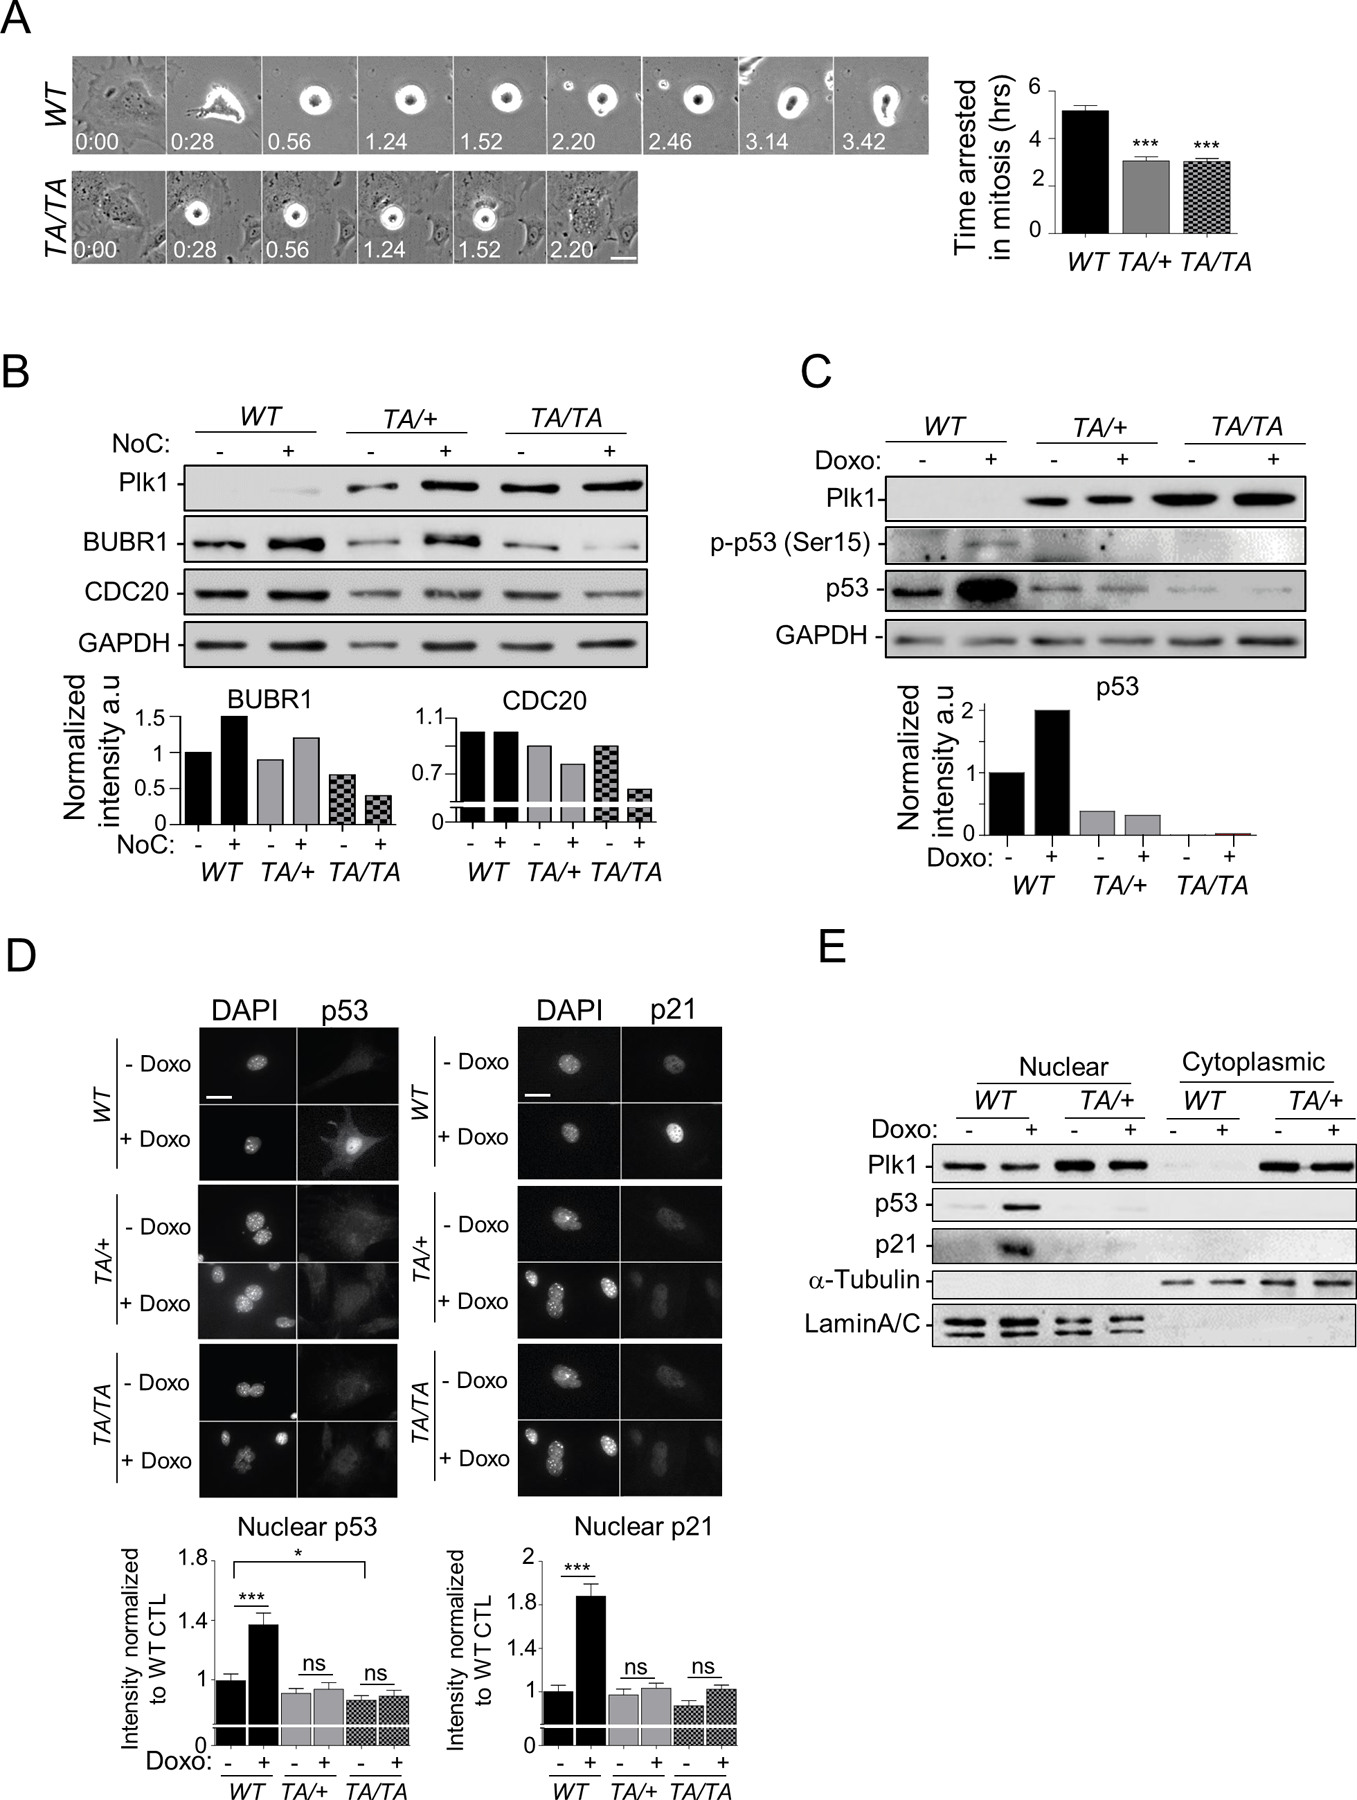
Figure 6: Plk1 overexpression impairs the cell cycle checkpoints.

(A) Synchronized G2 WT and Plk1 transgenic PMEFs were treated with nocodazole (NoC) (200 ng/ml) and tracked through mitotic entry and progression by phase-contrast video-microscopy (4 min/image). (Left) Time-lapse images of WT and TA/TA PMEFs arrested in mitosis by NoC treatment. (Right) Duration of mitotic arrest induced by NoC treatment in PMEFs. Fifty cells/genotype; repeated 3x. (Mean ± SEM, WT vs TA/+ or WT vs TA/TA ***: p < 0.001 t-test). (B) (Top) WB of untreated or Noc (200 ng/ml, 6 hours) treated WT and Plk1 transgenic PMEFs, Loading control: GAPDH. (Bottom) Quantification of BUBR1 and CDC20 expression levels normalized to GAPDH (C) (Top) Analysis of p53 expression and activity (p-p53 [Ser15]) in untreated or doxorubicin (Doxo) (0.5 mM for 2 hrs) treated WT and Plk1 transgenic PMEFs synchronized in G2. (Bottom) Quantification of p53 expression level normalized to GAPDH (D) (Top) Representative images of cells treated as in (C), and immunostained for p53 or p21. (Bottom) Quantification of p53 and p21 nuclear intensity using ImageJ software. 50 cells/genotype, repeated 3x. (Mean ± SEM, *: p < 0.05; ***: p < 0.001). Scale, 10 µm. (E) Nuclear and cytoplasmic p53 and p21 levels analyzed by WB from synchronous G2 PMEFs of indicated genotype treated as in (A). Loading and fractionation controls: α-Tubulin and Lamin A/C.
See Supplementary Fig.S5/56/7.
