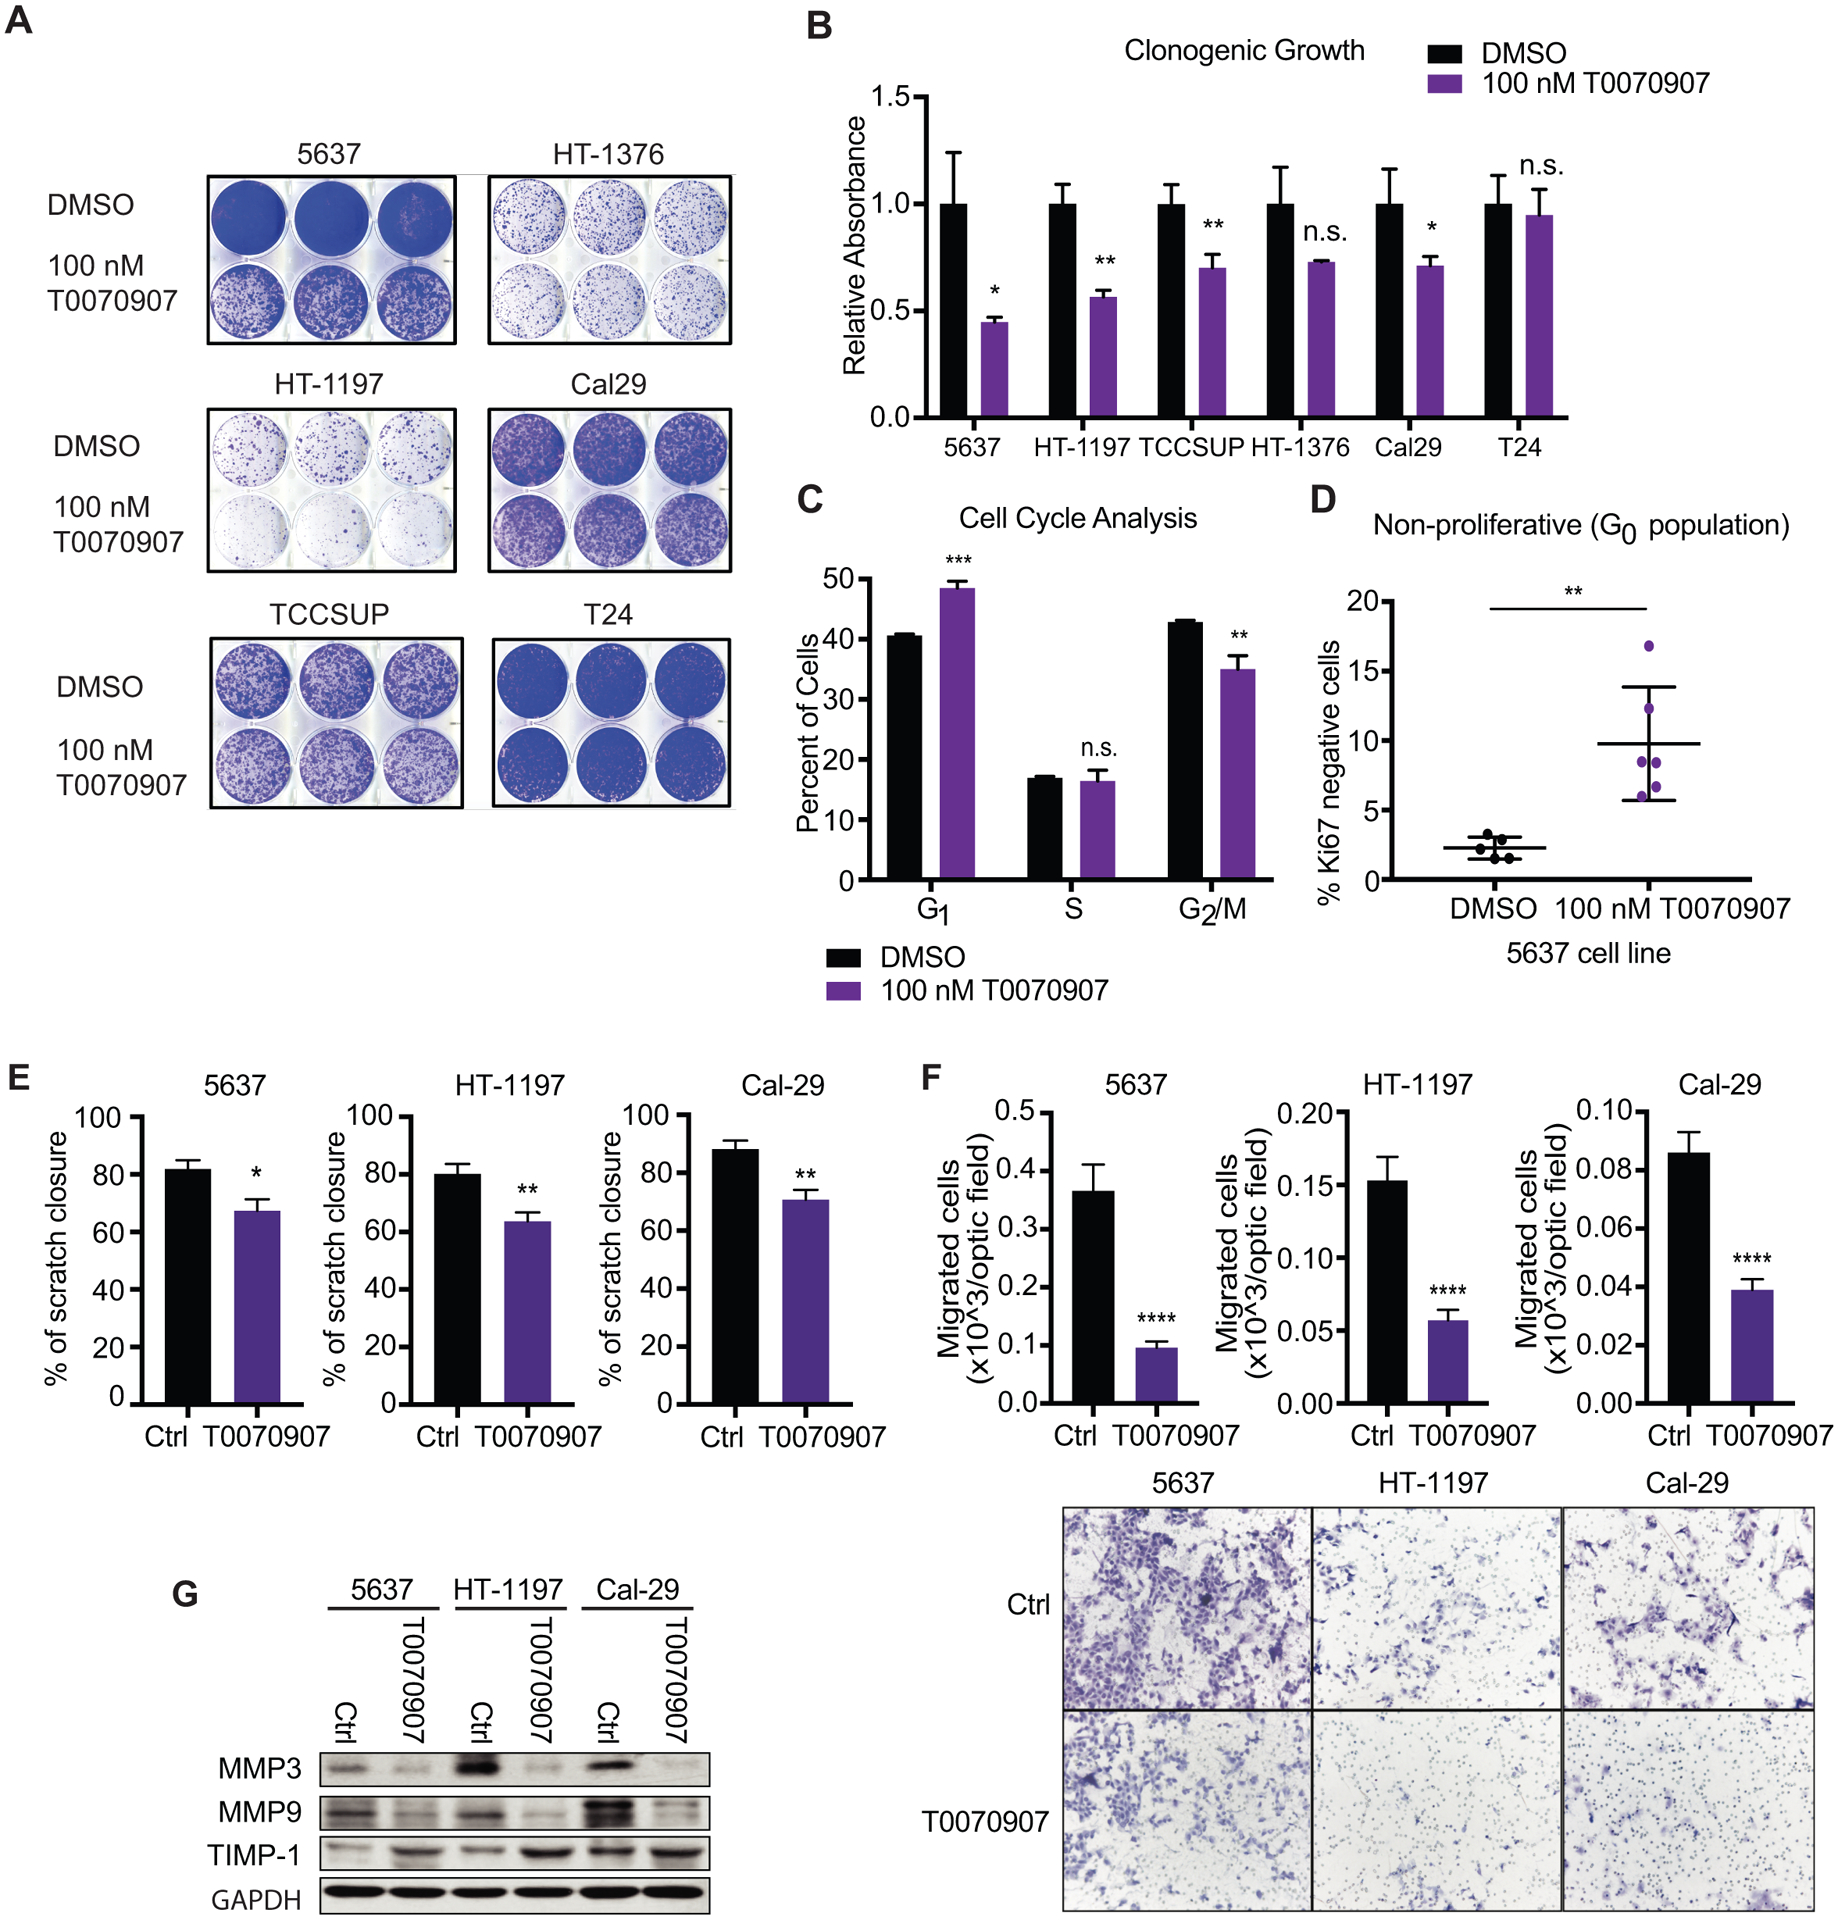
Figure 2 – Pharmacological inhibition of PPARγ reduces growth of multiple UC cell lines in vitro.

(A) Clonogenic growth of UC cell lines treated with DMSO or 100 nM T0070907 in long-term culture assayed by crystal violet staining. (B) Quantification of crystal violet staining in panel (A), depicted as relative absorbance compared to DMSO. (C) Percentage of 5637 cells in each phase of the cell cycle following DMSO or 100 nM T0070907 treatment, determined by flow cytometric analysis of propidium iodide staining. (D) Percentage of 5637 cells residing in the G0 cell cycle phase, following DMSO or 100 nM T0070907 treatment, identified as Ki67/PI double negative 5637 cells by flow cytometry. (E) Scratch wound migration assay of control and T0070907 treated cells. (F) Boyden chamber migration assay of control and T0070907 treated cells. Quantification (top), representative micrographs (bottom). (G) Western blot analysis of the migration markers Mmp3, Mmp9, and Timp1 in control and T0070907 treated cells. Data are presented as mean ± SEM. **** (p < 0.0001), *** (p < 0.001), ** (p < 0.01), * (p < 0.05), n.s. = not significant. Unpaired student t-test. Black asterisks represent p values for comparison between DMSO and 100nM T0070907 treated cells.
