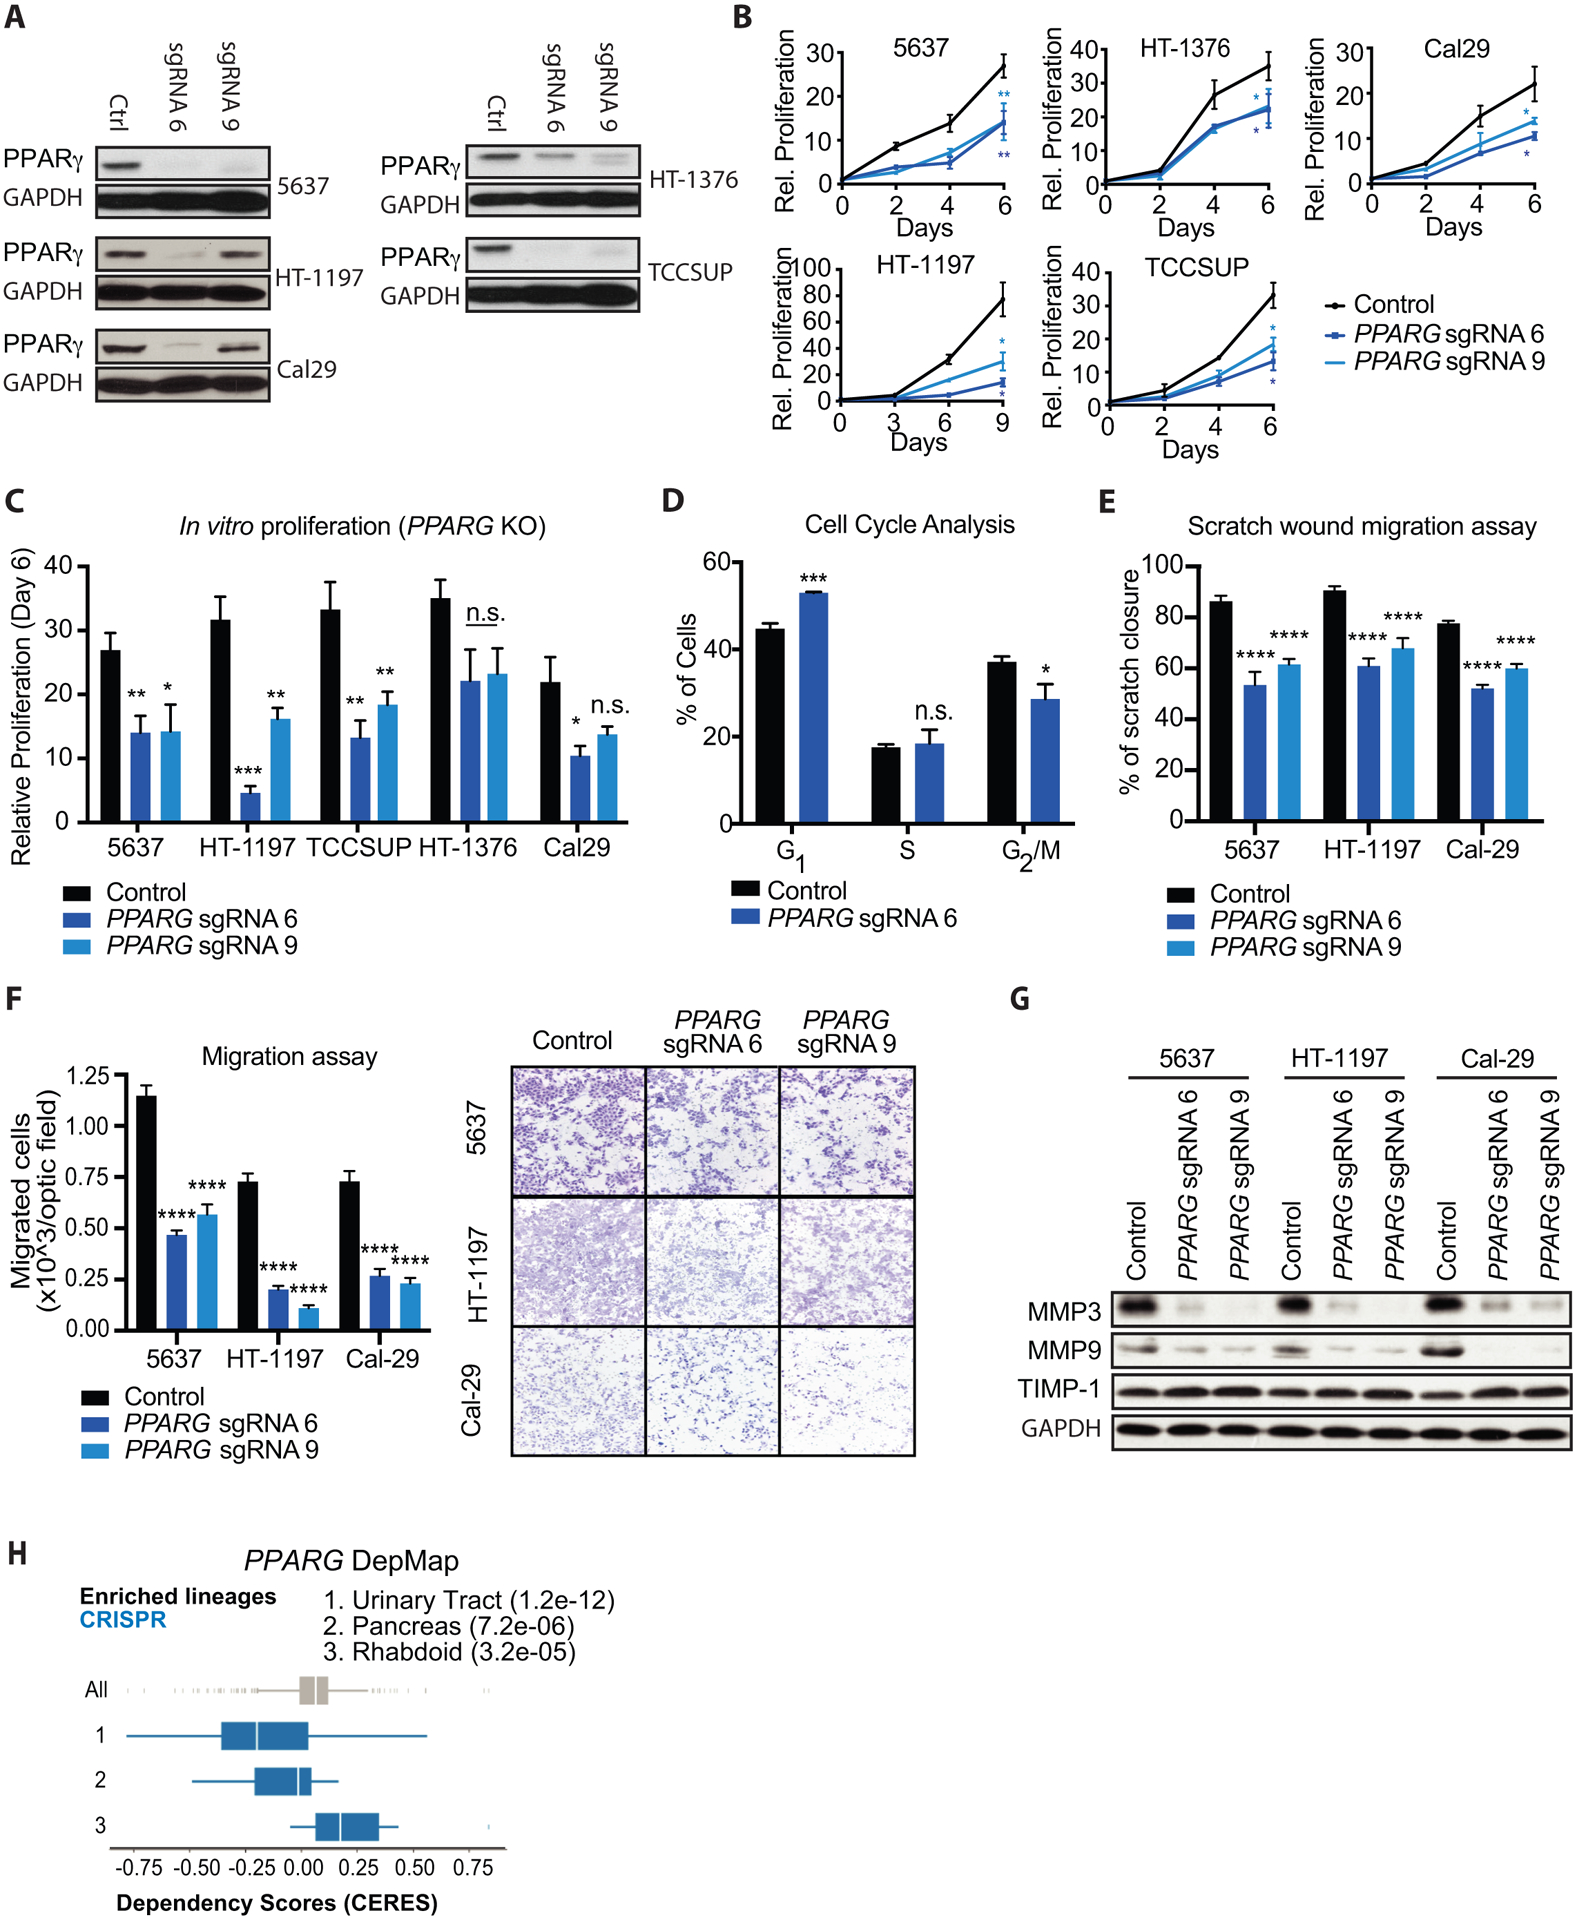
Figure 3 – Genetic inhibition of PPARγ reduces growth and migratory capacities of several UC cell lines in vitro.

(A) Western blot for PPARγ expression in control, PPARG sgRNA 6 (sgRNA 6) and PPARG sgRNA 9 (sgRNA 9) showing knock out efficiency in different UC cell lines. GAPDH was used as loading control. (B) Growth curves of control, PPARG sgRNA 6, and PPARG sgRNA 9 (PPARG KO) UC cell lines over the course of 6–9 days. Values are normalized to cell count of each cell line at the Day 0 timepoint. (C) Relative proliferation of PPARG KO to control cell lines at day 6 of the growth curves from panel (B). (D) Percentage of control and PPARG KO 5637 cells in each phase of the cell cycle, determined by flow cytometry staining of propidium iodide. (E) Scratch wound migration assays of control and PPARG KO UC cell lines. (F) Boyden chamber migration assays of control and PPARG KO cells, showing quantification (left) and representative micrographs (right). (G) Western blot for showing migration markers MMP3, MMP9 and TIMP1 in control, PPARG sgRNA 6 (sgRNA 6) and PPARG sgRNA 9 (sgRNA 9) UC cells. GAPDH was used as loading control. (H) DepMap analysis of PPARG CRISPR KO in Broad institute cell lines. A lower CERES score indicates that a given lineage is more sensitive to PPARG depletion. Data are presented as mean ± SEM. **** (p < 0.0001), *** (p < 0.001), ** (p < 0.01), * (p < 0.05), n.s. = not significant. Student’s two-tailed unpaired t-test for pairwise comparisons, one-way ANOVA for multiple comparisons, or two-way ANOVA for multiple comparisons involving two independent variables. Asterisks represent p values for comparison between control and PPARG sgRNA 6, and PPARG sgRNA 9 cells.
