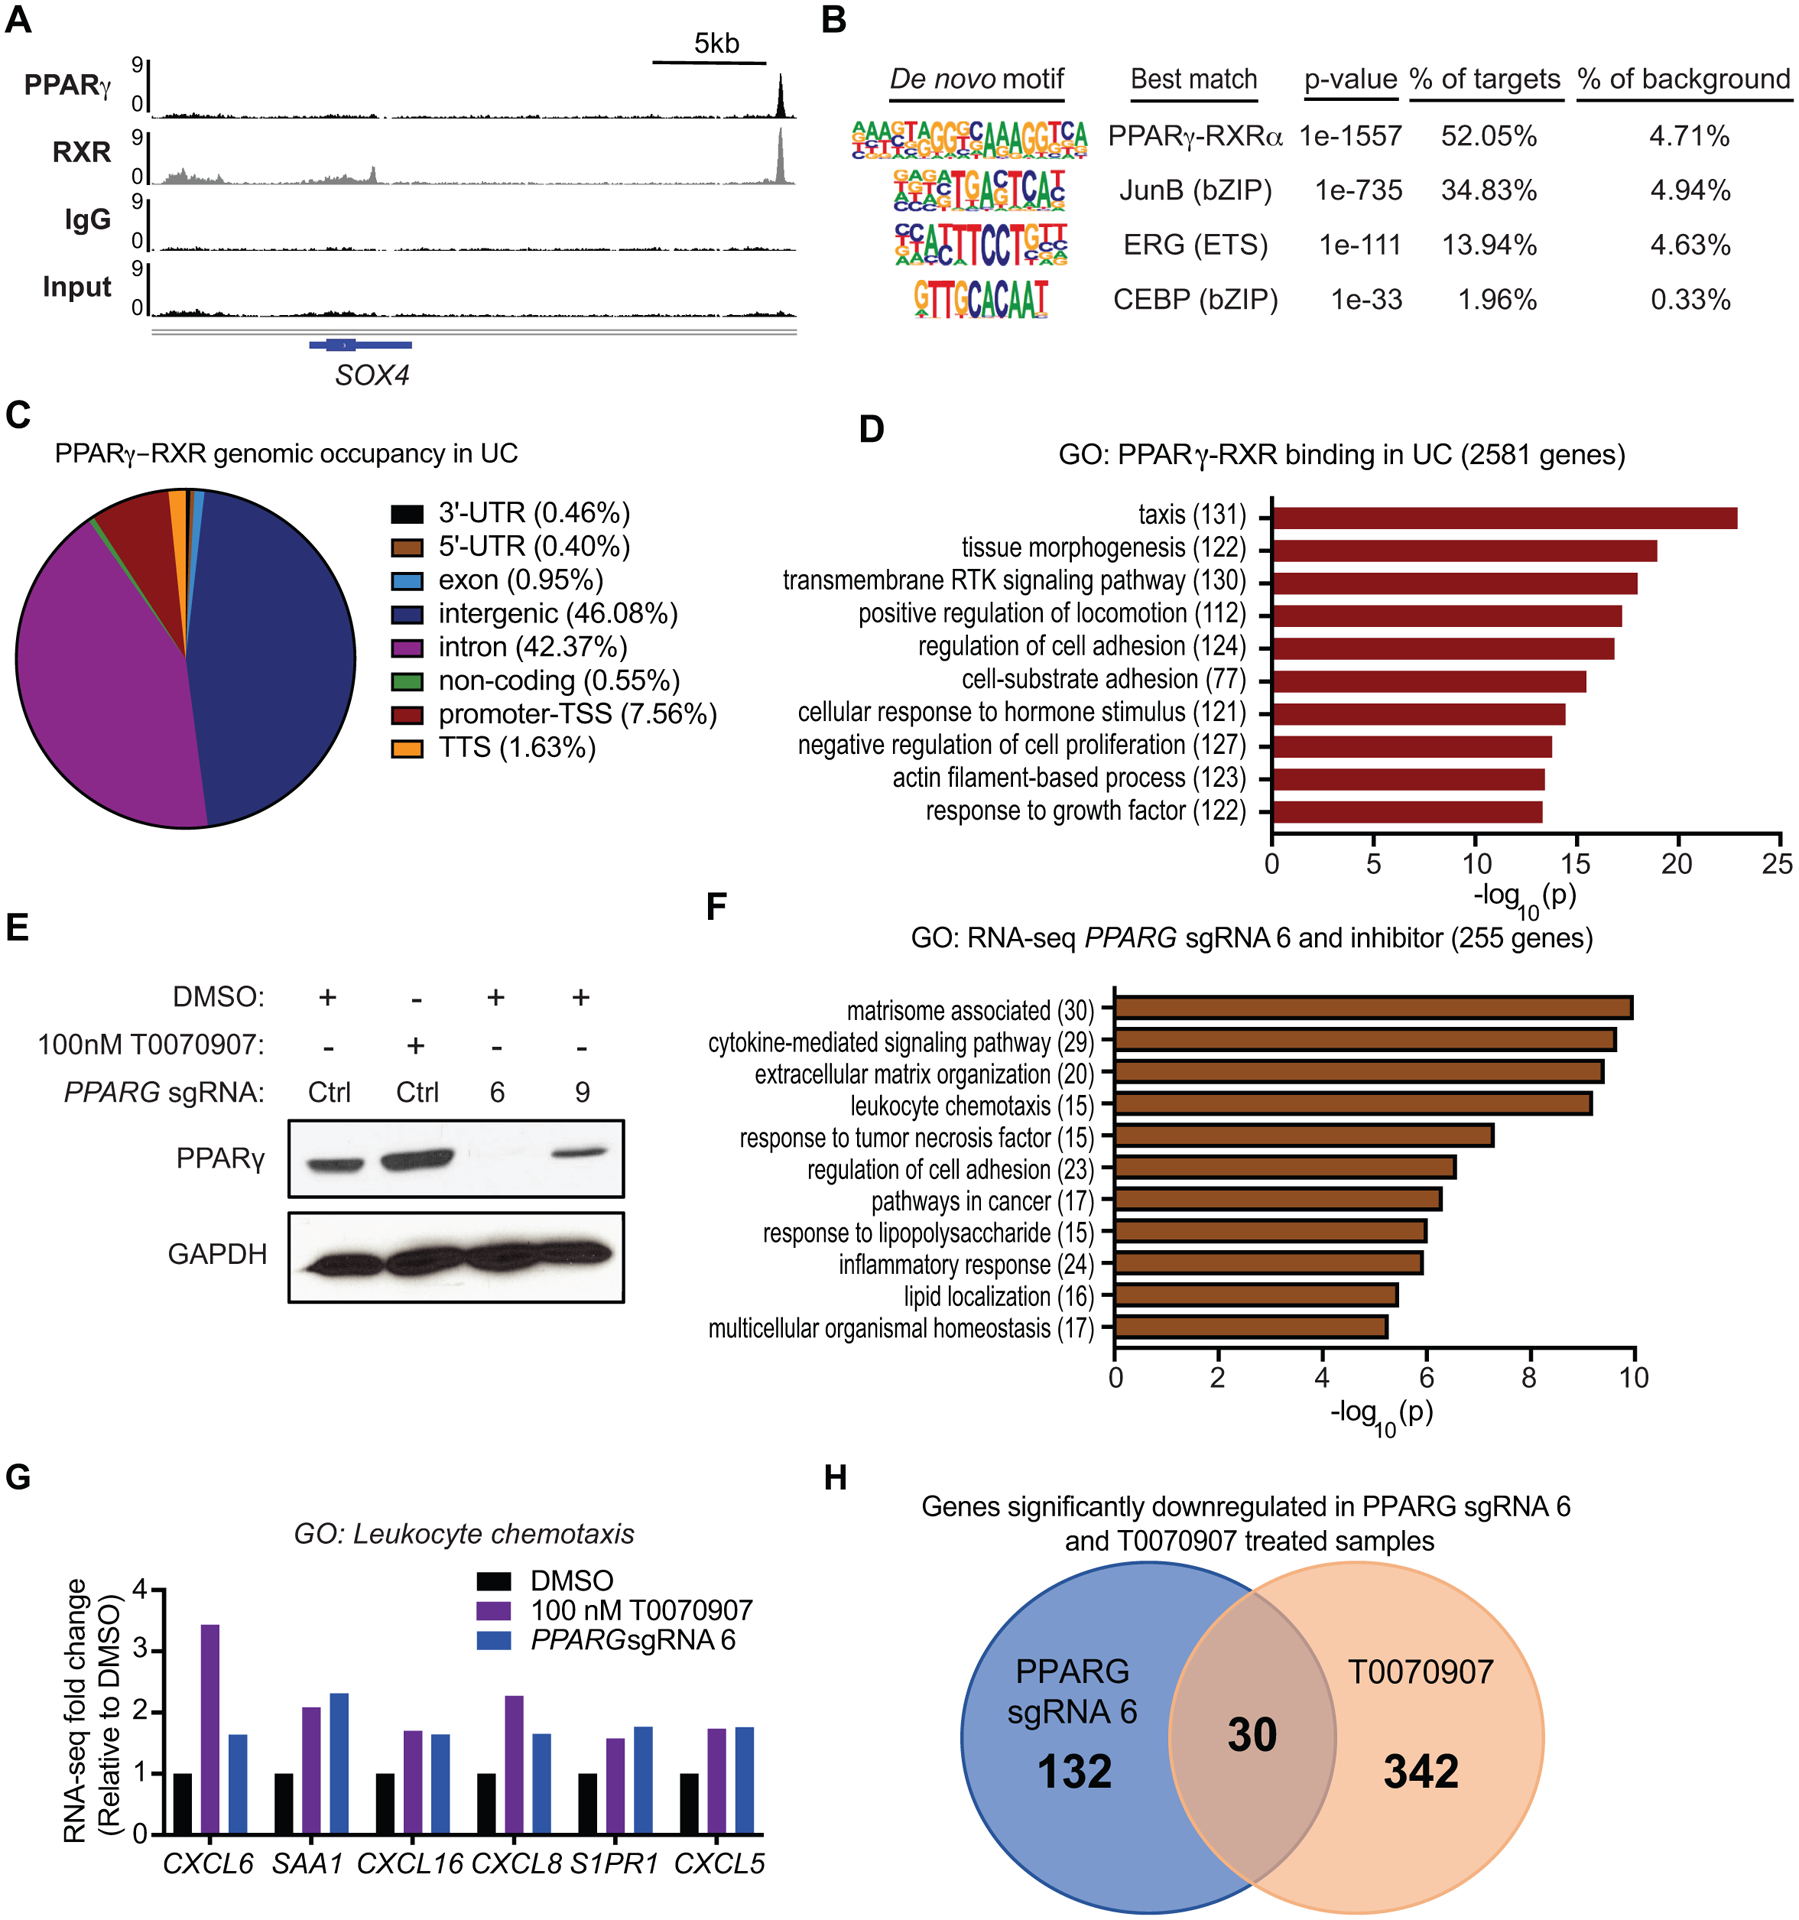
Figure 4 – Genome-wide analysis of PPARγ-RXR binding and gene regulation in UC.

(A) ChIP-seq tracks of PPARγ, RXR, IgG and Input, showing PPARγ-RXR occupancy ~22 kb downstream of SOX4. (B) De novo motif analysis of PPARγ-RXR binding sites in UC. (C) PPARγ-RXR genomic occupancy in UC, defined by HOMER annotate peaks. For bioinformatics analyses displayed in panels C and D, sites were defined by the following criteria: peak score ≥ 10 (≥ 1 read per million) and RXR peak called with strict overlap. (D) Gene ontology of PPARγ-RXR binding sites in UC, annotated to the nearest gene. (E) RNA-seq experimental design and Western blot for PPARγ expression following 100 nM T0070907, PPARG sgRNA 6 or PPARG sgRNA 9. GAPDH was used as loading control. (F) Gene ontology of significantly altered genes by both 100 nM T0070907 treatment and knockout by PPARG sgRNA 6. (G) RNA-seq gene expression changes for select GO category: leukocyte chemotaxis genes following 100 nM T0070907 or PPARG sgRNA 6, relative to DMSO. (H) Venn Diagram showing significantly down regulated genes in both PPARG sgRNA 6 and T0070907 treated 5637 samples as assessed by RNA-seq experiments.
