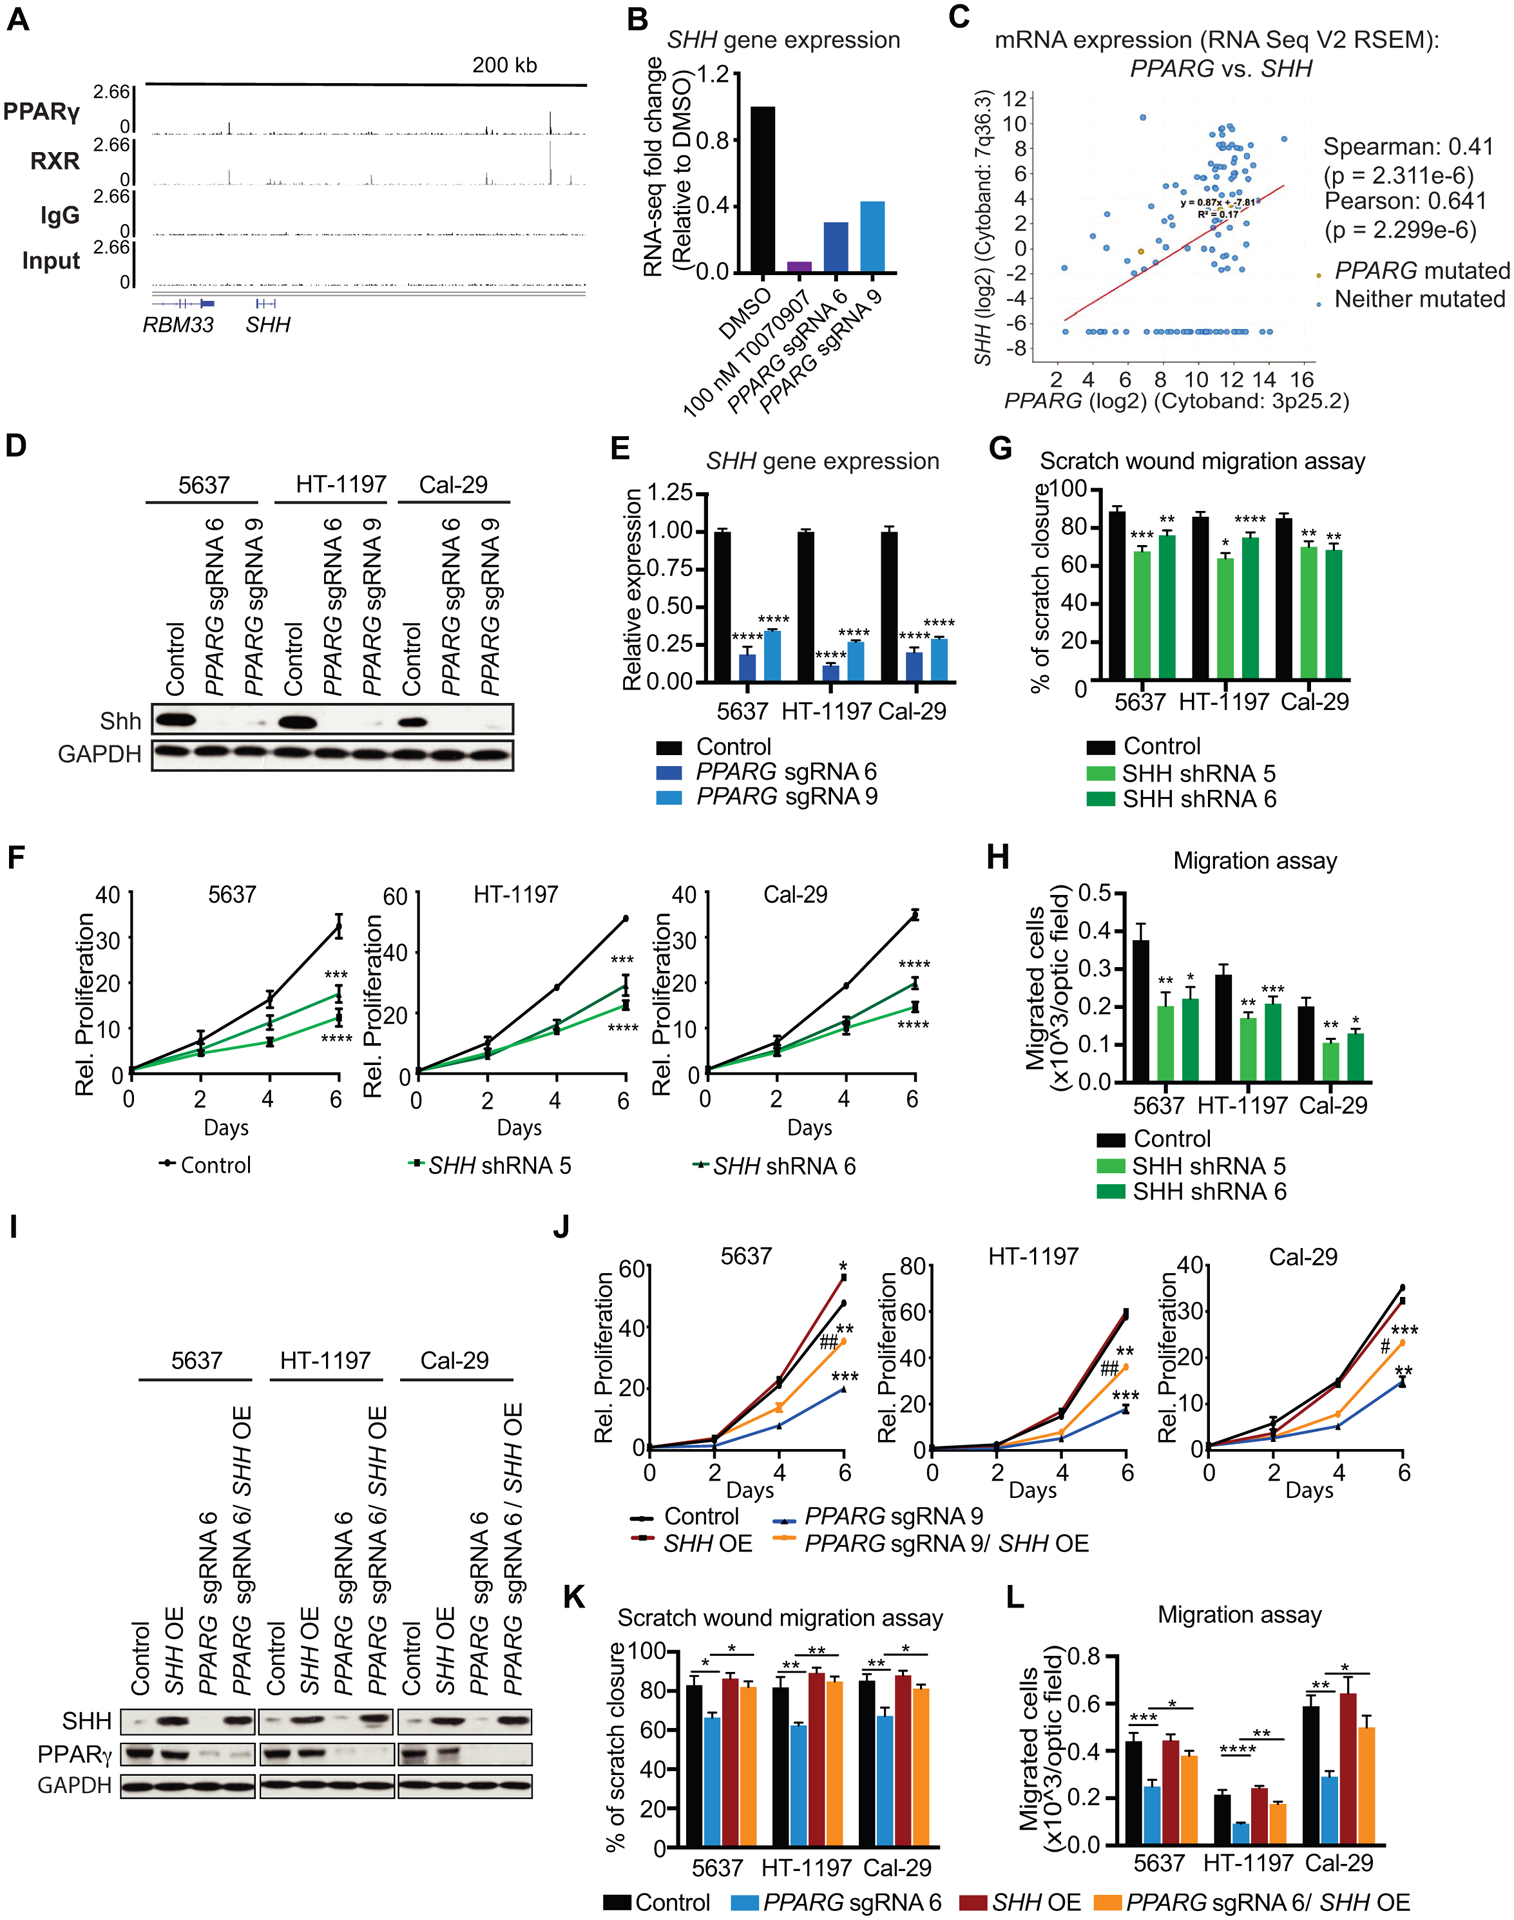
Figure 5 – Identification of PPARγ target genes of interest from ChIP-seq and RNA-seq data.

(A) ChIP-seq tracks of PPARγ, RXR, IgG and Input, showing PPARγ-RXR occupancy within 200 kb of SHH. (B) SHH gene expression data from RNA-seq in 100 nM T0070907, PPARG sgRNA 6, and PPARG sgRNA 9, relative to DMSO. (C) Co-expression data for PPARG and SHH in UC tumors from the TCGA provisional dataset (cBioPortal). (D) Western blot analysis for PPARγ and SHH of control, PPARG sgRNA 6, and sgRNA 9 in UC cell lines. GAPDH is used as loading control. (E) SHH mRNA expression in control, PPARG sgRNA 6, and PPARG sgRNA 9 UC cells. (F) Growth curves of control, SHH shRNA 5, and SHH shRNA 6 cells over the course of 6 days. Values are normalized to cell count of each line at the Day 0 timepoint. (G) Scratch wound migration assay of control, SHH shRNA 5, and SHH shRNA 6 UC cell lines. (H) Boyden chamber migration assay of control, SHH shRNA 5, and SHH shRNA 6 cells. (I) Western blot analysis for PPARγ and SHH of control, PPARG sgRNA 6, SHH OE, and PPARG sgRNA 6/ SHH OE in UC cell lines. GAPDH is used as loading control. (J) Growth curves of control, PPARG sgRNA 6, SHH OE, and PPARG sgRNA 6/ SHH OE cells over the course of 6 days. Values are normalized to cell count of each line at the Day 0 timepoint. (K) Scratch wound migration assay control, PPARG sgRNA 6, SHH OE, and PPARG sgRNA 6/ SHH OE cells. (L) Boyden chamber migration assay of control, PPARG sgRNA 6, SHH OE, and PPARG sgRNA 6/ SHH OE cells. Data are presented as mean ± SEM. **** (p < 0.0001), **** (p < 0.0001), *** (p < 0.001), * (p < 0.05), One-way ANOVA for multiple comparisons, or two-way ANOVA for multiple comparisons involving two independent variables. Asterisks represent p values for comparison between control and PPARG KO or SHH KD cells except for multiple comparisons.
