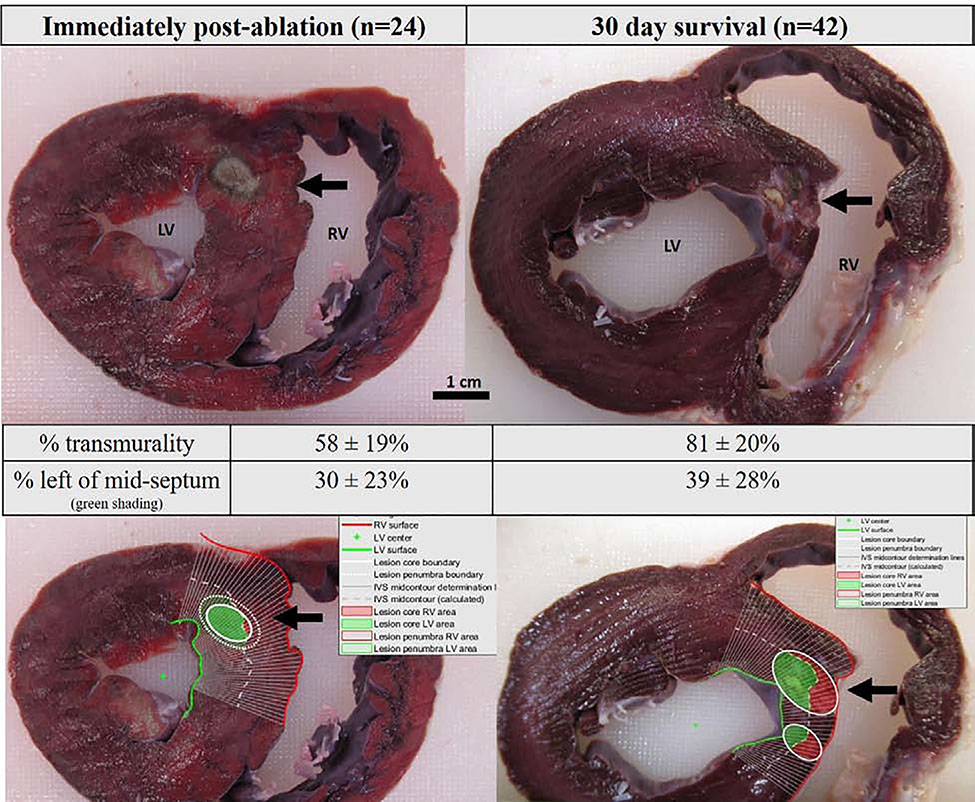
Figure 3.
Gross pathology images of in-vivo lesions immediately post-ablation (left) and at 30 days (right). Bottom row images demonstrate image processing with spline analysis defining the portion of lesion surface area to the right (red) and left ventricular (green) side of the septum, with the mid-septum defined as the white dotted line.

