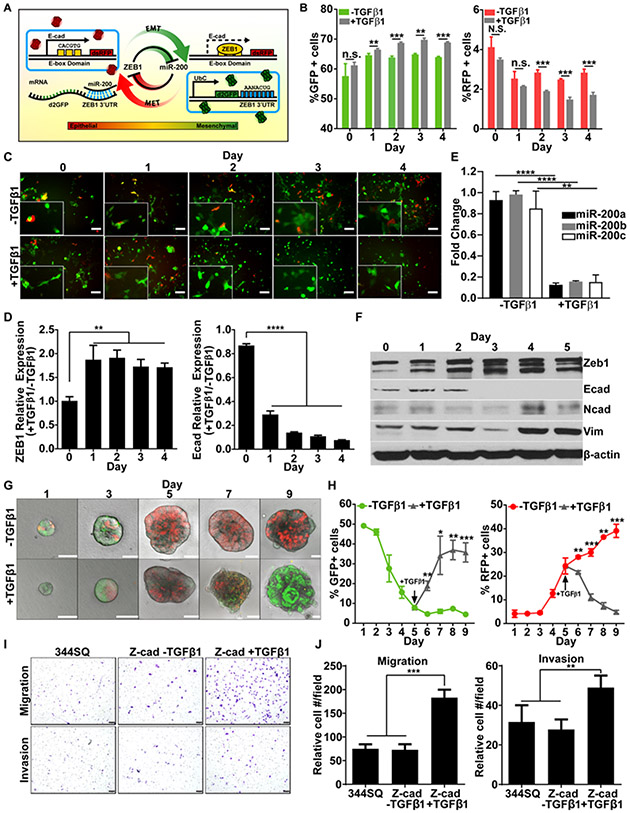
Figure 2. The Z-cad dual sensor dynamically detects EMT in murine NSCLC.
(A) Schematic diagram illustrating the Z-cad dual sensor constructs. The d2GFP-Zeb1 3’UTR construct constitutively expresses destabilized GFP under the control of a ubiquitin promoter. The Zeb1 3’ UTR, which contains 8 miR-200 binding sites, is expressed downstream of d2GFP. The E-cad-RFP construct contains the E-cadherin promoter, with 3 E-box domains. This promoter regulates the expression of RFP. (B) The Z-cad dual sensor system was expressed in the 344SQ murine cancer cells (344SQ_Z-cad cells). Flow cytometry for the percentage of GFP+ (left) and RFP+ (right) cells was performed over 4 days with and without TGF-β (5 ng/ml). Data was analyzed using unpaired Students t-test. N.S.= not significant, ** p< 0.01, *** p< 0.001. (C) The 344SQ_Z-cad cells were grown over 4 days with and without TGF-β (5 ng/ml) and fluorescent microscopy was performed. Representative images are shown. Scale bar=100 μM. (D) Real-time PCR (qPCR) analysis for relative expression of Zeb1 and E-cadherin in 344SQ_Z-cads over 4 days with and without TGF-β (5 ng/ml). Expression values are normalized against L32 reference gene. Statistical difference compared to day 0 for all samples. ** p< 0.01, **** p< 0.0001. (E) qPCR analysis of miR-200a/b/c in 344SQ_Z-cad cells with or without TGF-β treatment. Values were normalized to miR-16. (F) Western blot was performed on the 344SQ_Z-cad cells treated with TGF-β (5 ng/ml) over 5 days. Zeb1, E-cadherin, N-cadherin, and vimentin were probed as markers of EMT, and β-actin was used as a loading control. (G) Fluorescent confocal images were acquired of 344SQ_Z-cad cells plated on a Matrigel matrix. On day 5, TGF-β (5 ng/ml) was added. Confocal images acquired over 9 days and representative images are shown on each day. Scale bar = 50 μM. (H) Flow cytometry of the percentage of GFP+ and RFP+ cells was performed on the 344SQ_Z-cad 3D spheres grown over 9 days as described in F. TGF-β (5 ng/ml) added on Day 5 shown in gray line. Data was analyzed using unpaired Students t-test. * p< 0.05, ** p< 0.01, *** p< 0.001. (I) 344SQ wildtype and 344SQ_Z-cad cells −/+ TGF-β (5 ng/ml) were plated in Transwell migration and invasion assays. Representative images of chambers in each condition are shown. Scale bar = 1mm. (J) The relative cell number per field in migration and invasion chambers from (H) were analyzed. n= 3 chambers per condition. Data was analyzed using an unpaired Students t-test. ** p< 0.01, *** p< 0.001.

