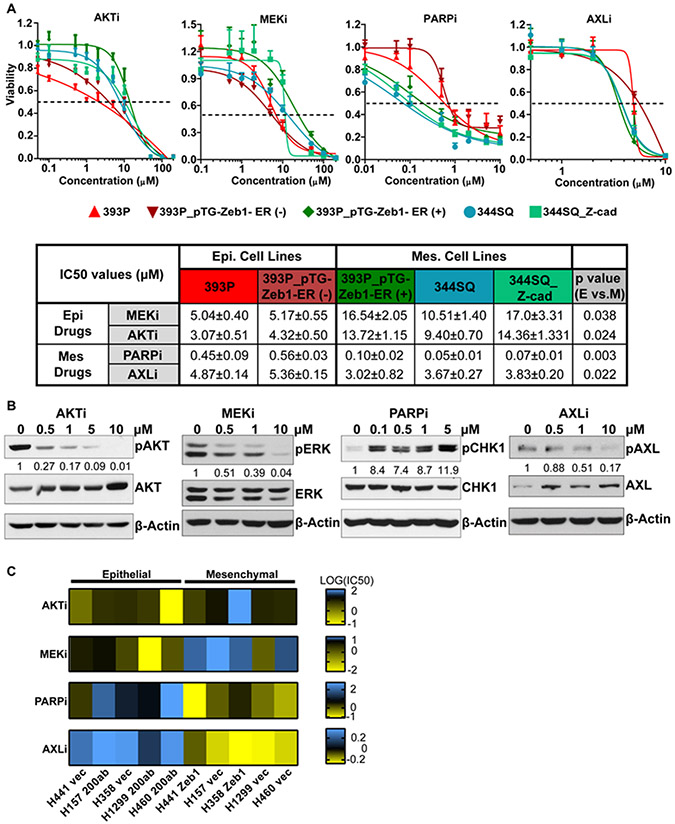
Figure 3. EMT alters sensitivity of cells to AKT, MEK, PARP, and AXL inhibitors in mouse and human lung cancer cell lines.
(A) In vitro cell viability was measured via MTT assay in epithelial cell lines (393P (red), 393P_pTG-Zeb1-ER (−) doxycycline (dark red)), and in mesenchymal cell lines (393P_pTG-Zeb1-ER (+) doxycycline (dark green), 344SQ (teal), and 344SQ_Z-cads (light green)) treated with MK2206 (AKTi), selumetinib (MEKi), talazoparib (PARPi), or bemcentinib (AXLi) for 72 hours. N = 8 per each drug concentration. The curve was generated using a nonlinear regression fit model. IC50 values are listed in the table below the graphs ± standard deviation. Statistical analysis was performed using an unpaired Students t-test comparing epithelial cells lines (reds) to mesenchymal cell lines (greens). (B) 344SQ_Z-cad cells were treated with each of the drugs from (A) for 48 hours, and western blot was utilized to demonstrate drug efficacy over a dose range. For AKT inhibitor treatment, phospho-AKT was used to demonstrate efficacy. Phosphorylated ERK was used as a marker for MEK inhibitor efficacy. With treatment with PARP inhibitor, increased expression of phospho-CHK1 was used to demonstrate drug efficacy. Phospho-AXL was used to demonstrate efficacy of AXL inhibitor treatment. Total levels of proteins and β-actin were used as controls across all drug treatments. Concentrations of drugs utilized are depicted above each lane. Densitometry calculations were performed using ImageJ software. The phosphorylated protein of interest was measured and normalized to the loading control for each sample, and then normalized to the control (first lane) for each drug. (C) Human NSCLC cell lines were also tested for sensitivity to the drugs described in (A) as a function of EMT. Epithelial cell lines used were H358 and H441 and mesenchymal cell lines used were H460, H157, and H1299. The epithelial cells were driven to undergo EMT via doxycycline inducible Zeb1 and mesenchymal cells were driven to undergo MET via doxycycline inducible miR-200ab. The vector only cell lines were used as controls. IC50 values were obtained for each cell line with each drug treatment, log transformed, and graphed on a heatmap with blue indicating high IC50 values and yellow indicating low IC50 values.

