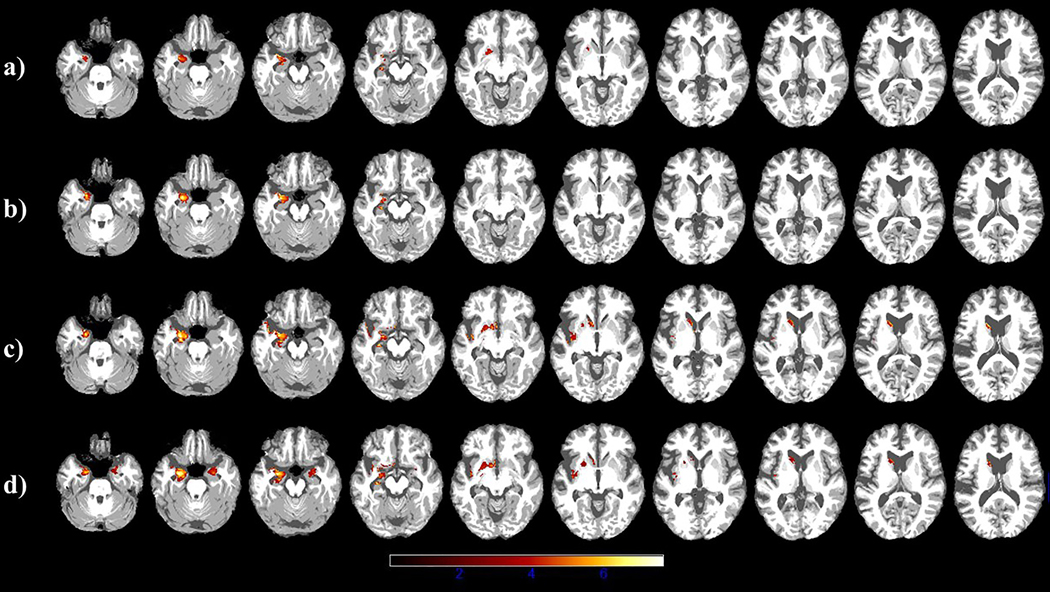
Figure 6.
Axial images showing changes in atrophy over time. Regions of significant cortical atrophy are shown prior to (a) and following (b) passive sentence treatment, and prior to (c) and following (d) object cleft treatment. Lighter colors indicate regions of greater atrophy in DK’s brain compared to a group of healthy participants (N=76).

