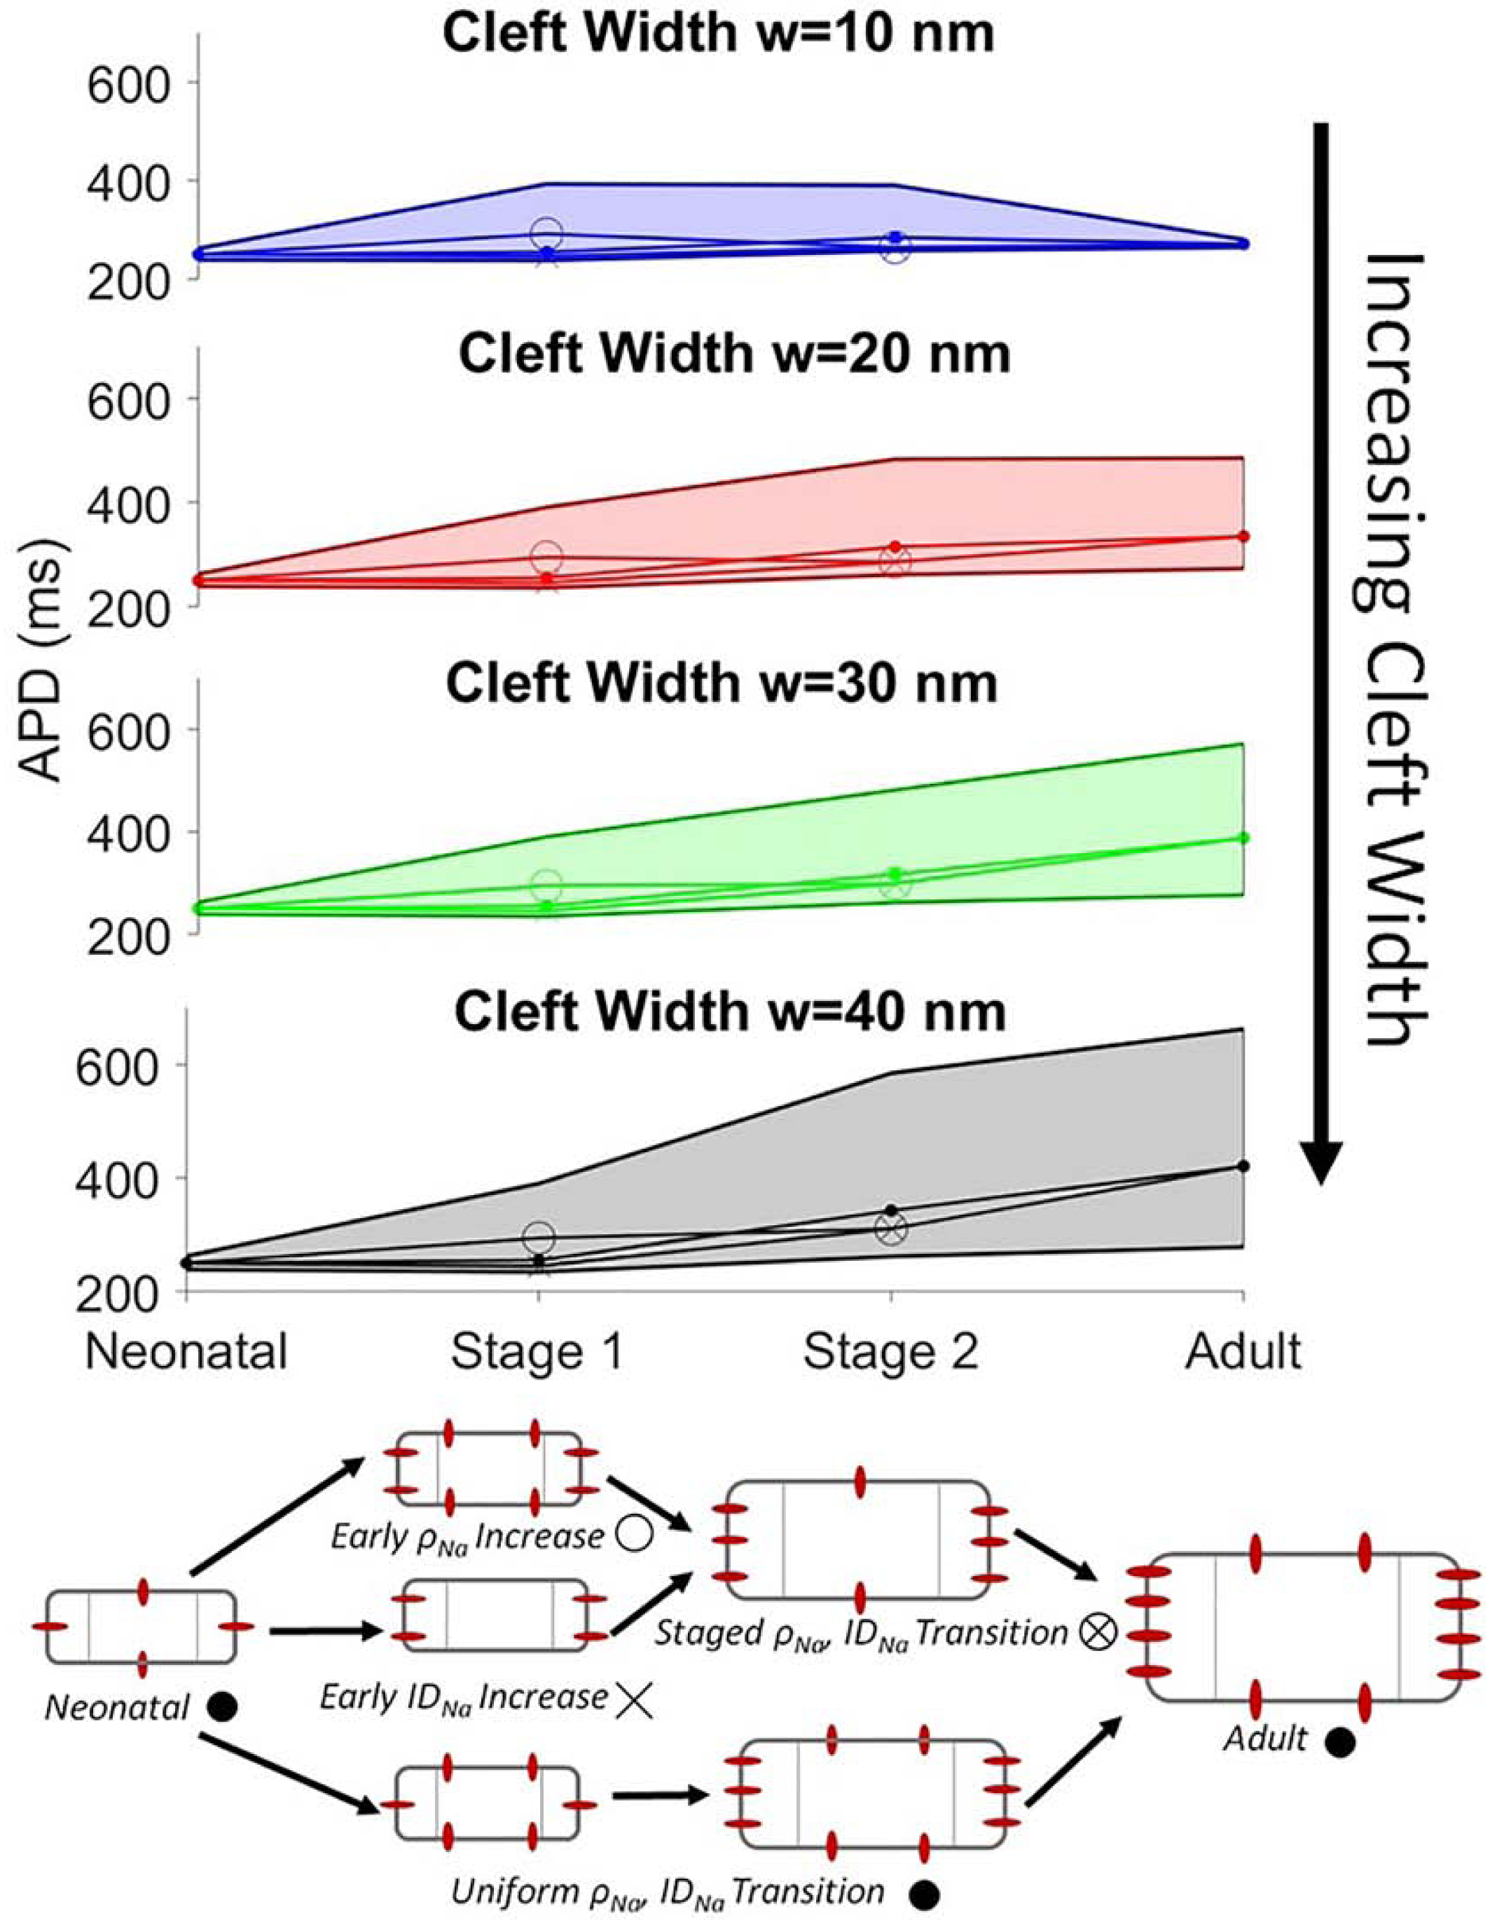
Figure 8:

Age-associated manifestation of action potential duration (APD) prolongation. The range of APD values (see text for details) are shown as functions of age-dependent progression, for different cleft widths w. Parameter ranges for each stage are shown in Table S2. Markers for each stage are shown in the illustration (bottom), with the value shown for each stage representing the average APD value over all conditions within the specified parameter ranges. BCL = 1000 ms.
