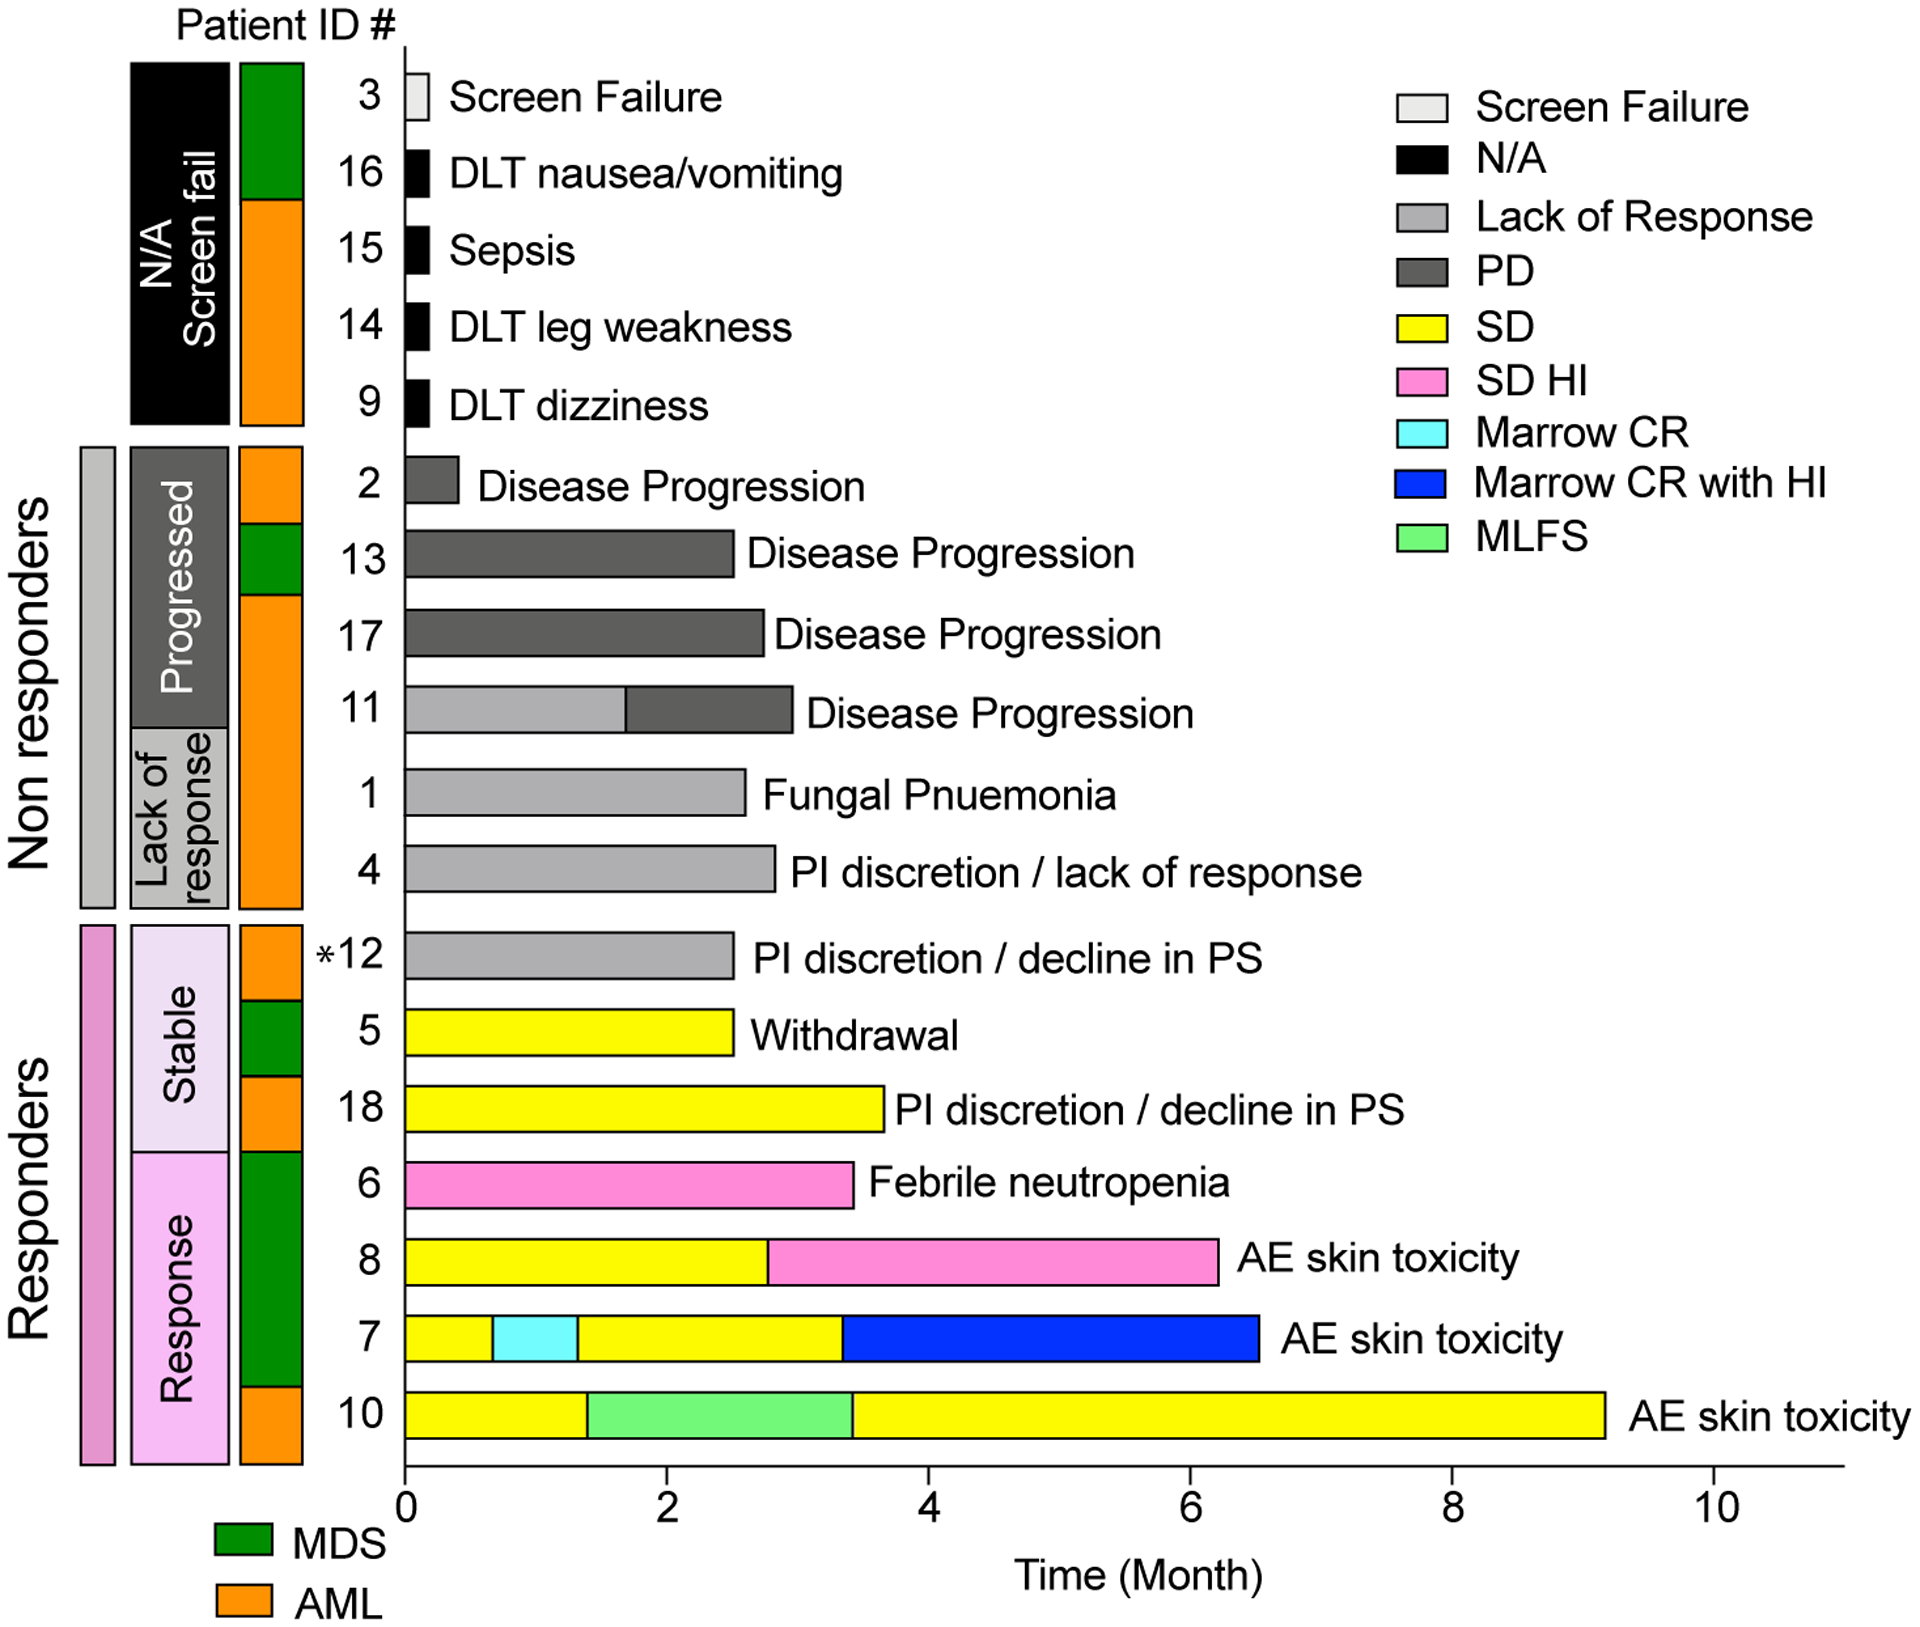
Figure 1. Clinical course of the patients and disease type distributions.

A) Swimmer’s plot where horizontal bars represent the duration on study for a cohort of 18 patients (17 treated and 1 screen-failure [Patient #3]). Bars are color-coded by the patient’s clinical working group response (Screen failure and N/A, non-evaluable response; PD, progressive disease; SD, stable disease; SD HI, stable disease with hematologic improvement; Marrow CR, marrow complete remission; Marrow CR with HI, marrow complete remission with hematologic improvement; MLFS, morphologic leukemia-free state). The reason for study discontinuation is listed at the end of each bar. Among the response evaluable patients, patients are grouped as responders (response/SD) by the pink vertical bar, and non-responders (lack or response/PD) by the grey vertical bar. An additional vertical bar color-codes the diagnosed disease type (MDS in green, AML in orange). *Patient #12 had neutrophil recovery and blast reduction but did not qualify for a clinical response. This patient’s RNA-seq signature clustered with the other responders.
