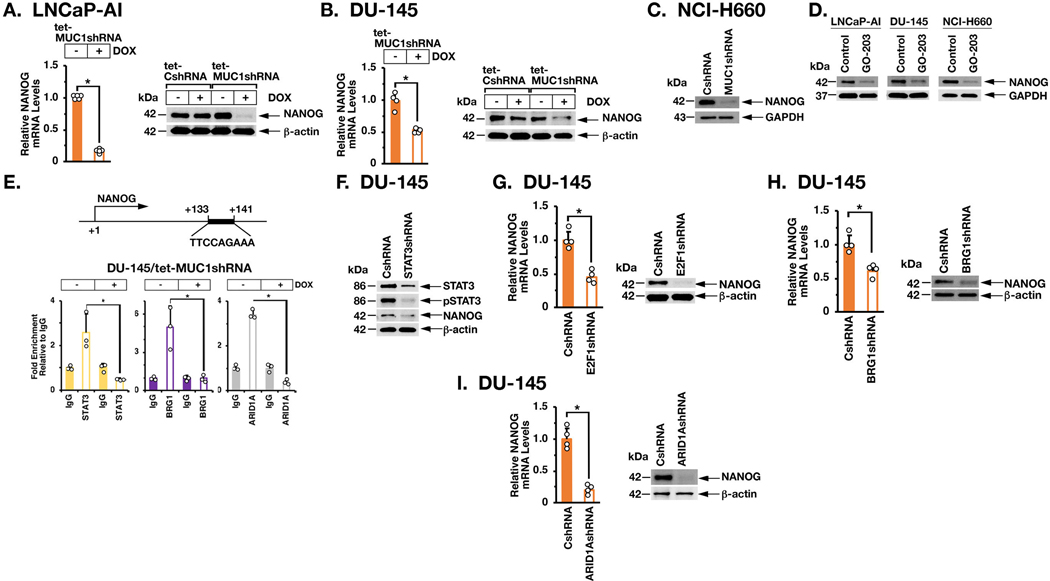
Figure 6. MUC1-C→E2F→BAF signaling activates NANOG expression.
A. LNCaP-AI/tet-MUC1shRNA cells were treated with control vehicle or DOX for 7 days. NANOG mRNA levels were analyzed by qRT-PCR (left). The results (mean±SD of 5 determinations) are expressed as relative mRNA levels compared to that in control cells (assigned a value of 1). LNCaP-AI/tet-CshRNA and LNCaP-AI/tet-MUC1shRNA cells were treated with vehicle or DOX for 7 days (right). Lysates were immunoblotted with antibodies against the indicated proteins. B. DU-145/tet-MUC1shRNA cells were treated with control vehicle or DOX for 7 days. NANOG mRNA levels were analyzed by qRT-PCR (left). The results (mean±SD of 4 determinations) are expressed as relative mRNA levels compared to that in control cells (assigned a value of 1). DU-145/tet-CshRNA and DU-145/tet-MUC1shRNA cells were treated with vehicle or DOX for 7 days (right). Lysates were immunoblotted with antibodies against the indicated proteins. C. Lysates from NCI-H660/CshRNA and NCI-H660/MUC1shRNA cells were immunoblotted with antibodies against the indicated proteins. D. The indicated cells were left untreated or treated with 5 μM GO-203 for 48 h. Lysates were immunoblotted with antibodies against the indicated proteins. E. Schema of the NANOG enhancer region with positioning of the STAT3 binding site. DU-145/tet-MUC1shRNA cells were treated with vehicle or DOX for 7 days. Soluble chromatin was precipitated with anti-STAT3, anti-BRG1, anti-ARID1A or a control IgG. The DNA samples were amplified by qPCR with primers for the NANOG enhancer region. The results (mean±SD of 3 determinations) are expressed as the relative fold enrichment compared to that obtained with the IgG control (assigned a value of 1). F. Lysates from DU-145/CshRNA and DU-145/STAT3shRNA cells were immunoblotted with antibodies against the indicated proteins. G-I. DU-145/CshRNA, DU-145/E2F1shRNA (G), DU-145/BRG1shRNA (H) and DU-145/ARID1AshRNA (I) cells were analyzed for NANOG mRNA levels by qRT-PCR. The results (mean±SD of 4 determinations) are expressed as relative mRNA levels compared to that in control cells (assigned a value of 1) (left). Lysates were immunoblotted with antibodies against the indicated proteins (right).

