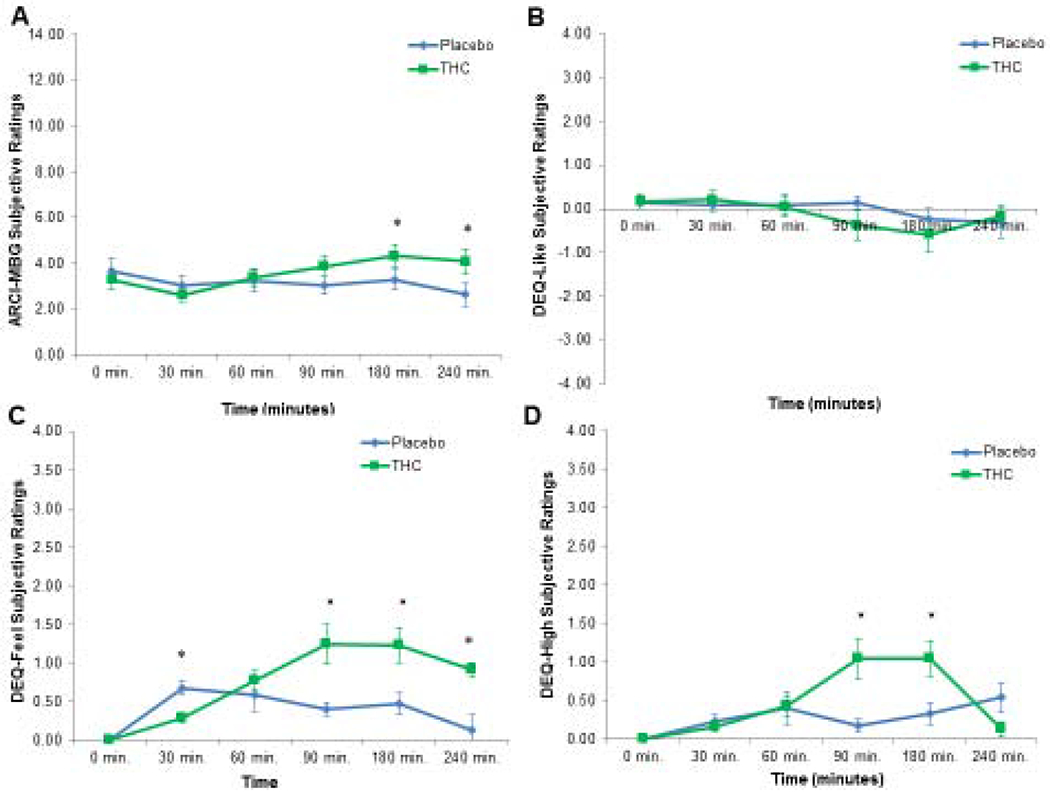
Figure 2.

Group Differences in Subjective Drug Responses Over Time. Panel A shows ARCI-MBG scores for the placebo and THC groups over time (*, p< .05). Panel B shows DEQ-Like scores for the placebo and THC groups over time (*, p< .05). Panel C shows DEQ-Feel scores for the placebo and THC groups over time (*, p< .05). Panel D shows DEQ-High scores for the placebo and THC groups over time (*, p< .05).
